Basic line chart with ggplot2 and geom_line()
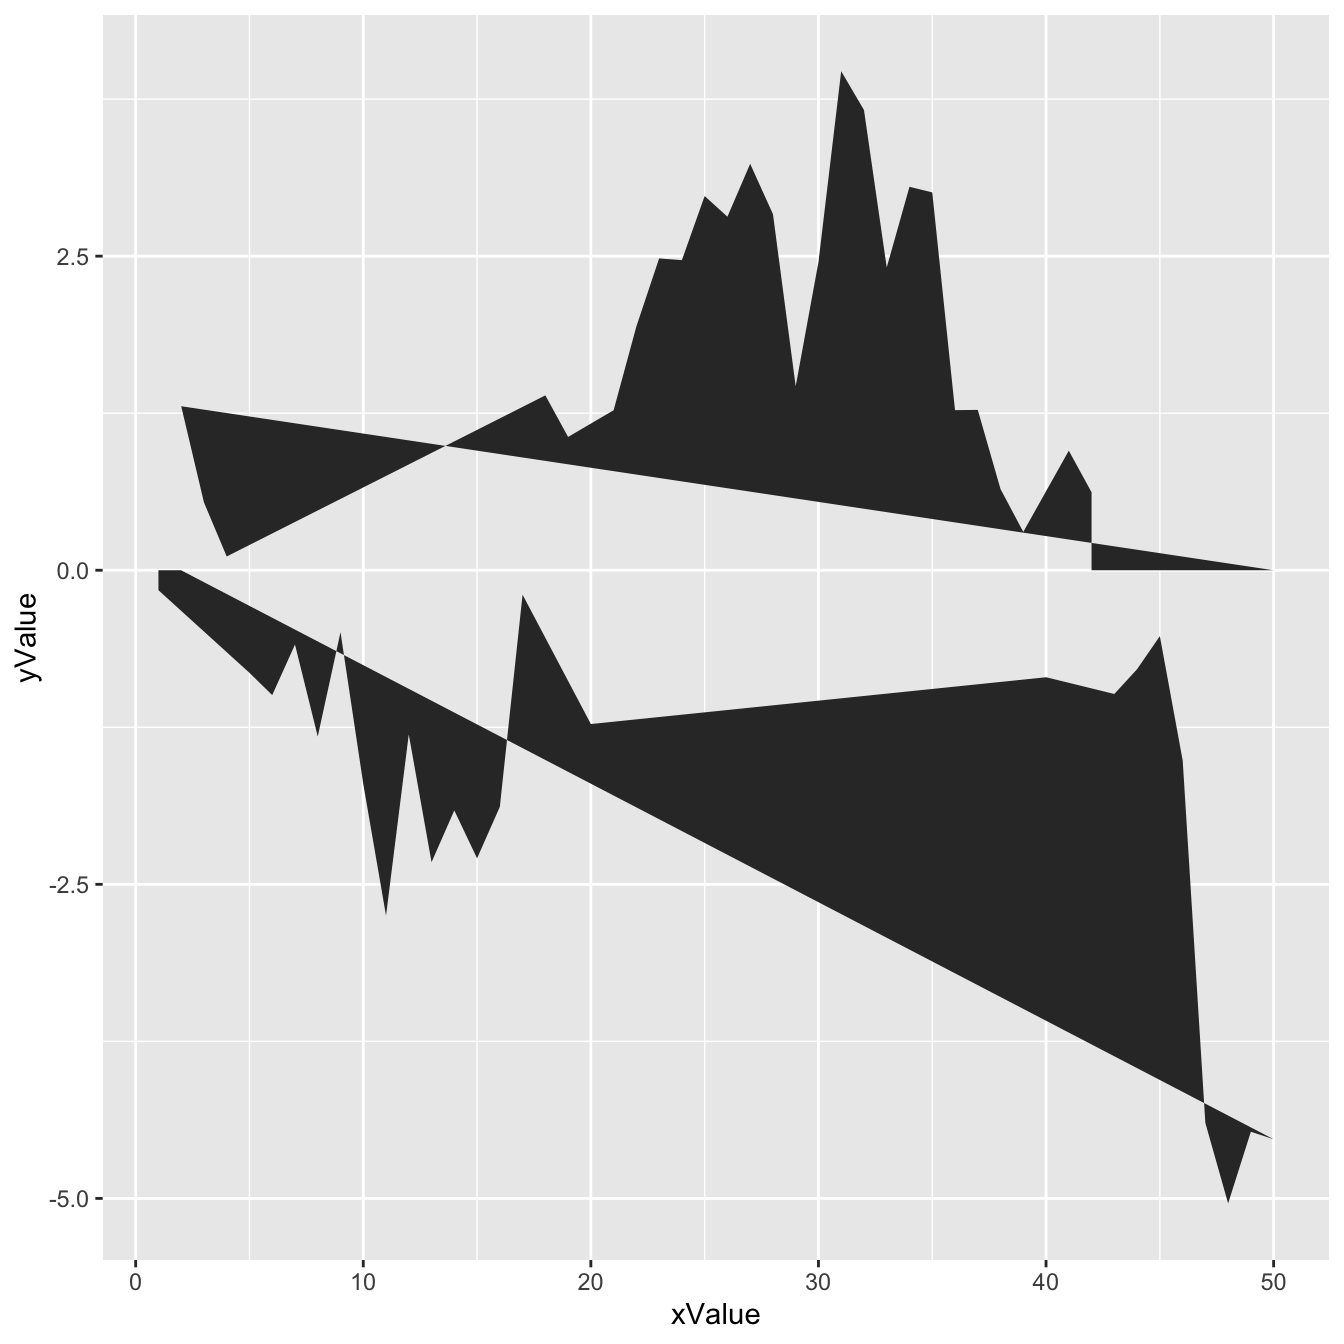
An area chart displays the evolution of one or several numeric variables. Data points are usually connected by straight line segments, and the area between the X axis and the line is filled. See data-to-viz for a more in-depth definition.
As for a line chart, the input data frame requires at least 2 columns:
- An ordered numeric variable for the X axis
- Another numeric variable for the Y axis
Once the data is read by ggplot2 and those 2 variables are specified
in the x and y arguments of the
aes(), just call the geom_area() function.
# Libraries
library(ggplot2)

# create data
xValue <- 1:50
yValue <- cumsum(rnorm(50))
data <- data.frame(xValue,yValue)

# Plot
ggplot(data, aes(x=xValue, y=yValue)) +
  geom_area()
Customize the line chart
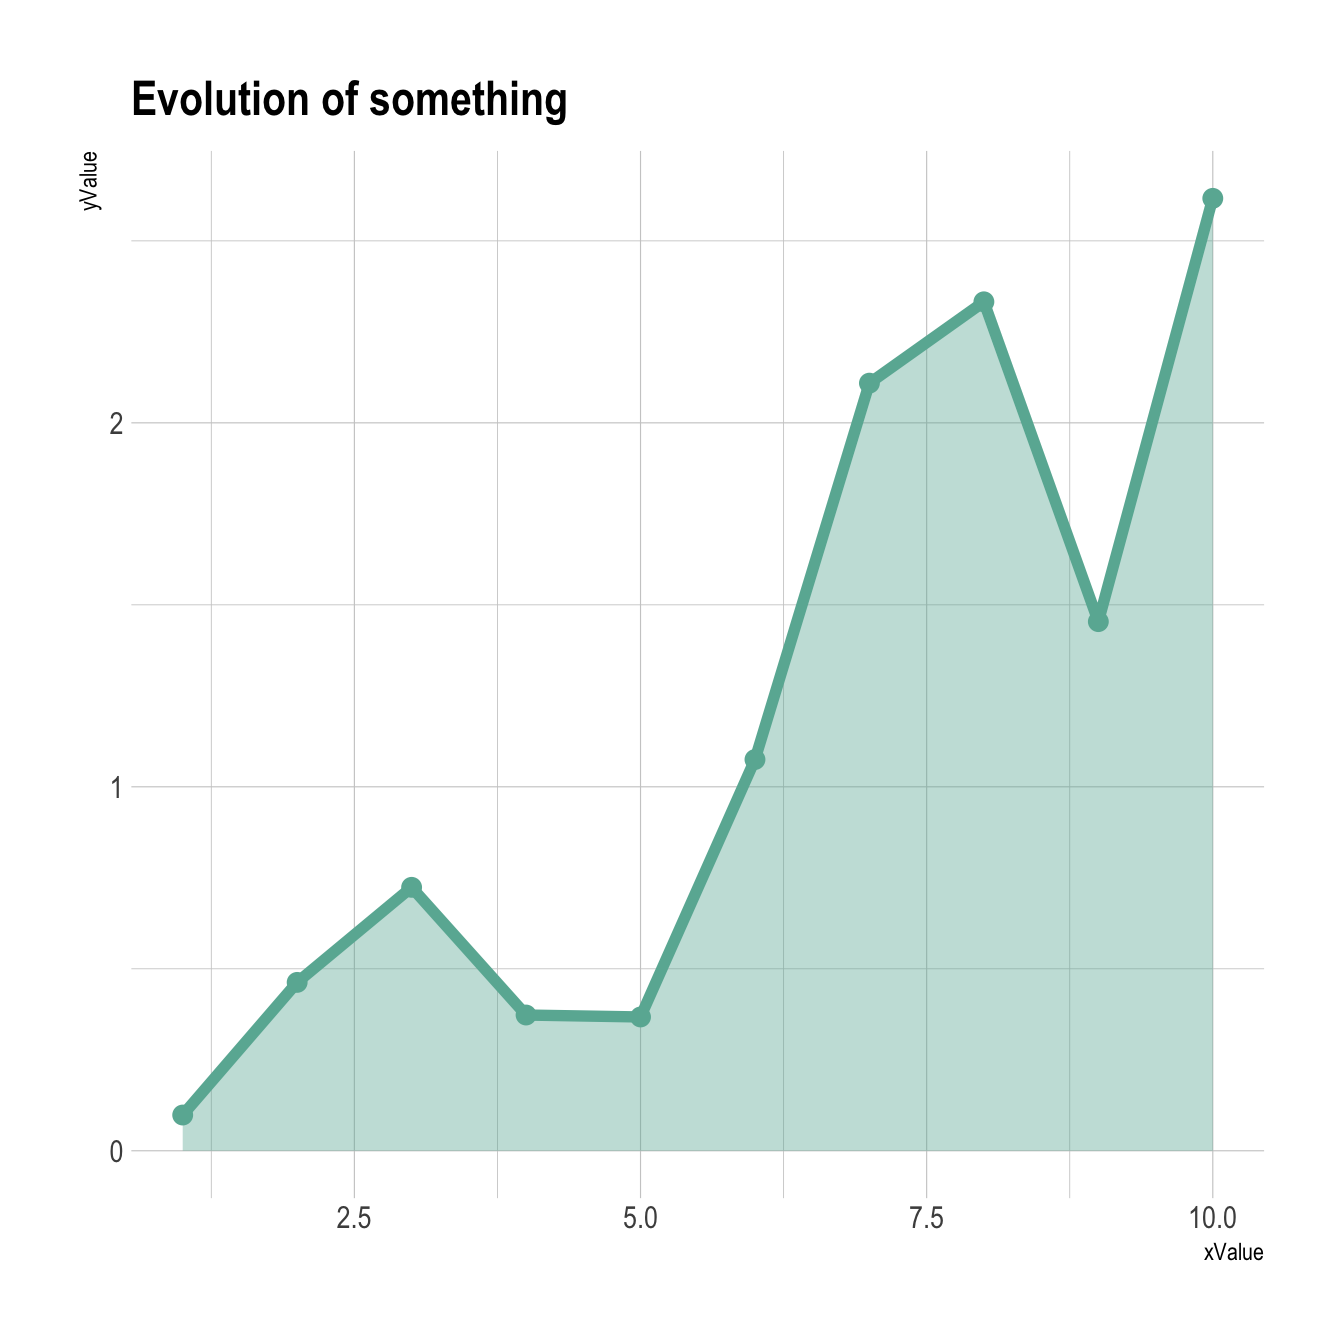
Several options are available to customize the area chart appearance:
- Add a title with
ggtitle(). -
Change line style with arguments like
shape,size,colorand more. -
Add transparency to the filled region with
opacity -
Custom the general theme with the
theme_ipsum()function of thehrbrthemespackage. - Highlight the top line with
geom_line() -
If not too many observation, show individual data points with
geom_point()
More generally, visit the [ggplot2 section] for more ggplot2 related stuff.
# Libraries
library(ggplot2)
library(hrbrthemes)

# create data
xValue <- 1:10
yValue <- abs(cumsum(rnorm(10)))
data <- data.frame(xValue,yValue)

# Plot
ggplot(data, aes(x=xValue, y=yValue)) +
  geom_area( fill="#69b3a2", alpha=0.4) +
  geom_line(color="#69b3a2", size=2) +
  geom_point(size=3, color="#69b3a2") +
  theme_ipsum() +
  ggtitle("Evolution of something")