The cartography package is a very good alternative to
the other tools presented in the
gallery for building maps.
It notably allows to:
- display a legend with embedded circles
- add data sources on the bottom of the chart
- show north / south
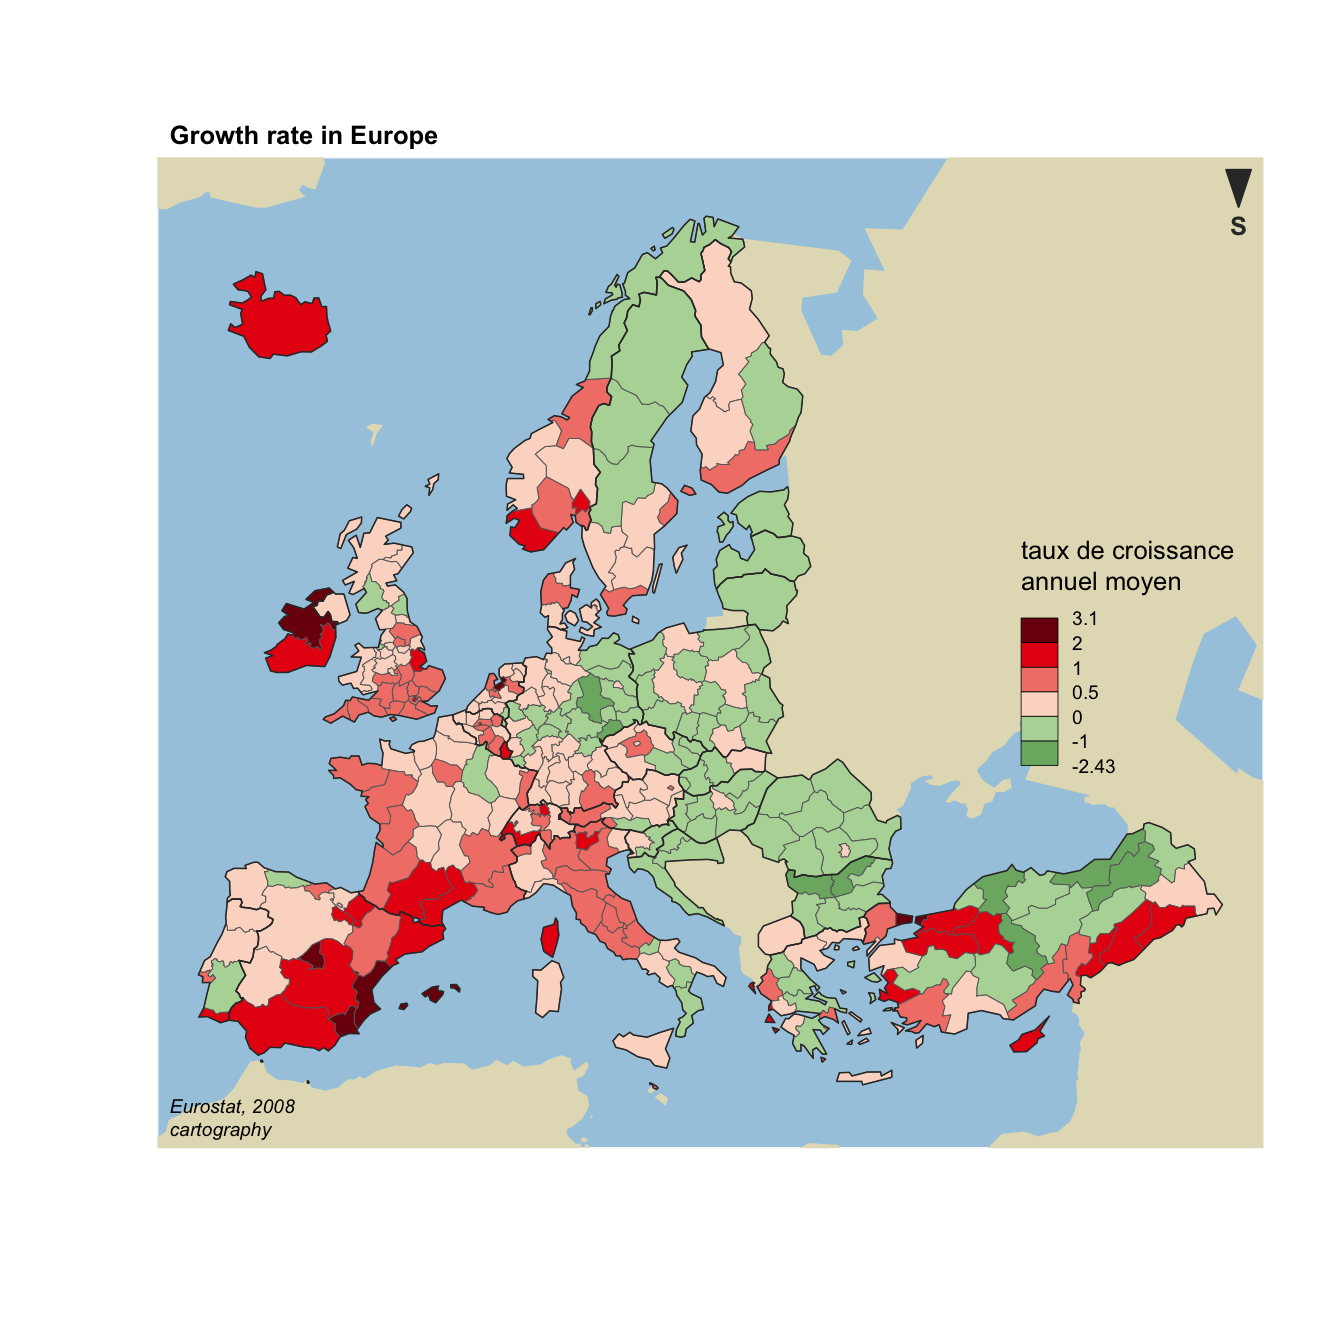
# Cartography Library
library(cartography)
library(sp)

# Upload data attached with the package.
data(nuts2006)

# Now we have a spdf file (shape file) called nuts2.spdf with shape of european regions.
# We also have a dataframe with information concerning every region.Both object have a first column "id" that makes the link between them.
head(nuts2.df)

# Annual growth per region
nuts2.df$cagr <- 100 * (((nuts2.df$pop2008/nuts2.df$pop1999)^(1/9)) -  1)

# Build a color palette
cols <- carto.pal(pal1 = "green.pal", n1 = 2, pal2 = "red.pal", n2 = 4)

# plot backgroud shapes (sea and world)
plot(nuts0.spdf, border = NA, col = NA, bg = "#A6CAE0")
plot(world.spdf, col = "#E3DEBF", border = NA, add = TRUE)

# Add annual growth
choroLayer(spdf = nuts2.spdf, df = nuts2.df, var = "cagr",
    breaks = c(-2.43, -1, 0, 0.5, 1, 2, 3.1), col = cols,
    border = "grey40", lwd = 0.5, legend.pos = "right",
    legend.title.txt = "taux de croissance\nannuel moyen",
    legend.values.rnd = 2, add = TRUE)

# Add borders
plot(nuts0.spdf, border = "grey20", lwd = 0.75, add = TRUE)

# Add titles, legend ...
layoutLayer(title = "Growth rate in Europe",
    author = "cartography", sources = "Eurostat, 2008",
    frame = TRUE, col = NA, scale = NULL, coltitle = "black",
    south = TRUE)