Most basic treemap with R


This post explains how to build a very basic treemap with R. It uses the treemap package, provides reproducible code and explains how input data must be formatted.

Treemap section Data to Viz

Most basic treemap


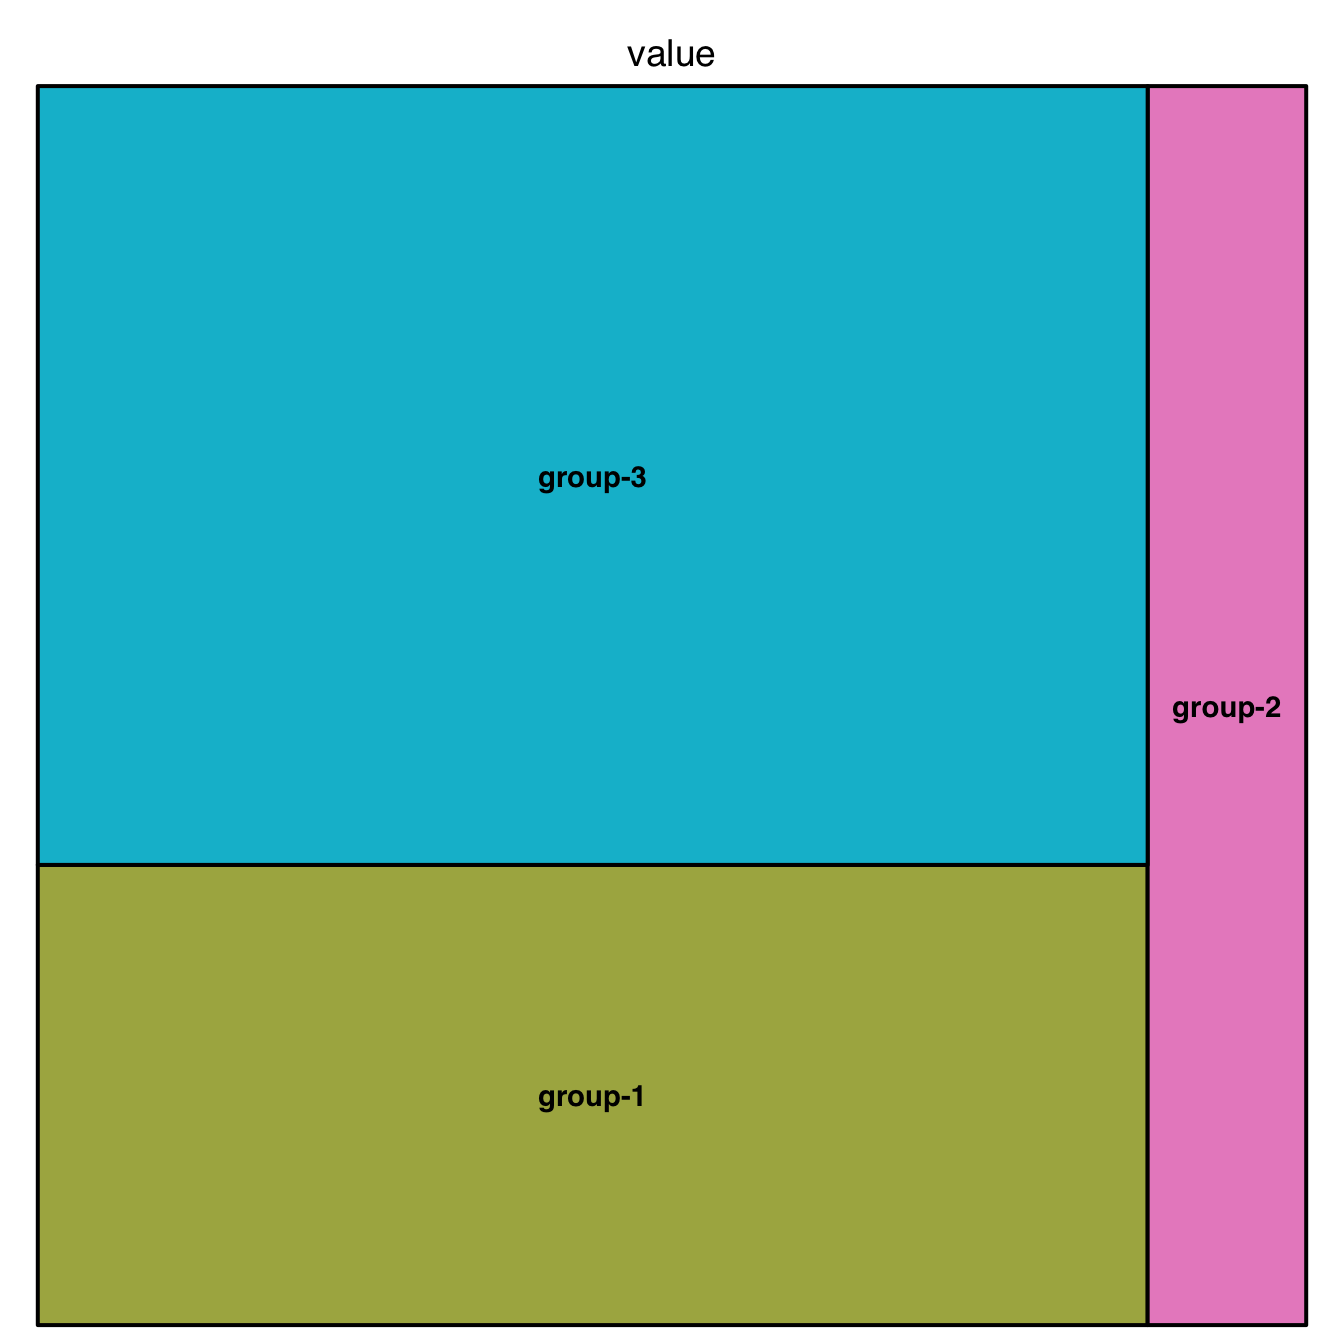
This is the most basic treemap you can do. The input dataset is simple: we just have 3 groups, and each has a value which we map to an area.

It allows to learn the syntax of the treemap library: you need to provide at least a dataset (data), the column that provides groups (index), and the column that gives the size of each group (vSize).

See graph #235 to learn how to add subgroups, and graph #236 to customize the chart appearance.

# library
library(treemap)
 
# Create data
group <- c("group-1","group-2","group-3")
value <- c(13,5,22)
data <- data.frame(group,value)
 
# treemap
treemap(data,
            index="group",
            vSize="value",
            type="index"
            )

Related chart types


Grouped and Stacked barplot
Treemap
Doughnut
Pie chart
Dendrogram
Circular packing


Contact

This document is a work by Yan Holtz. Any feedback is highly encouraged. You can fill an issue on Github, drop me a message on Twitter, or send an email pasting yan.holtz.data with gmail.com.

Github Twitter