Histogram without border


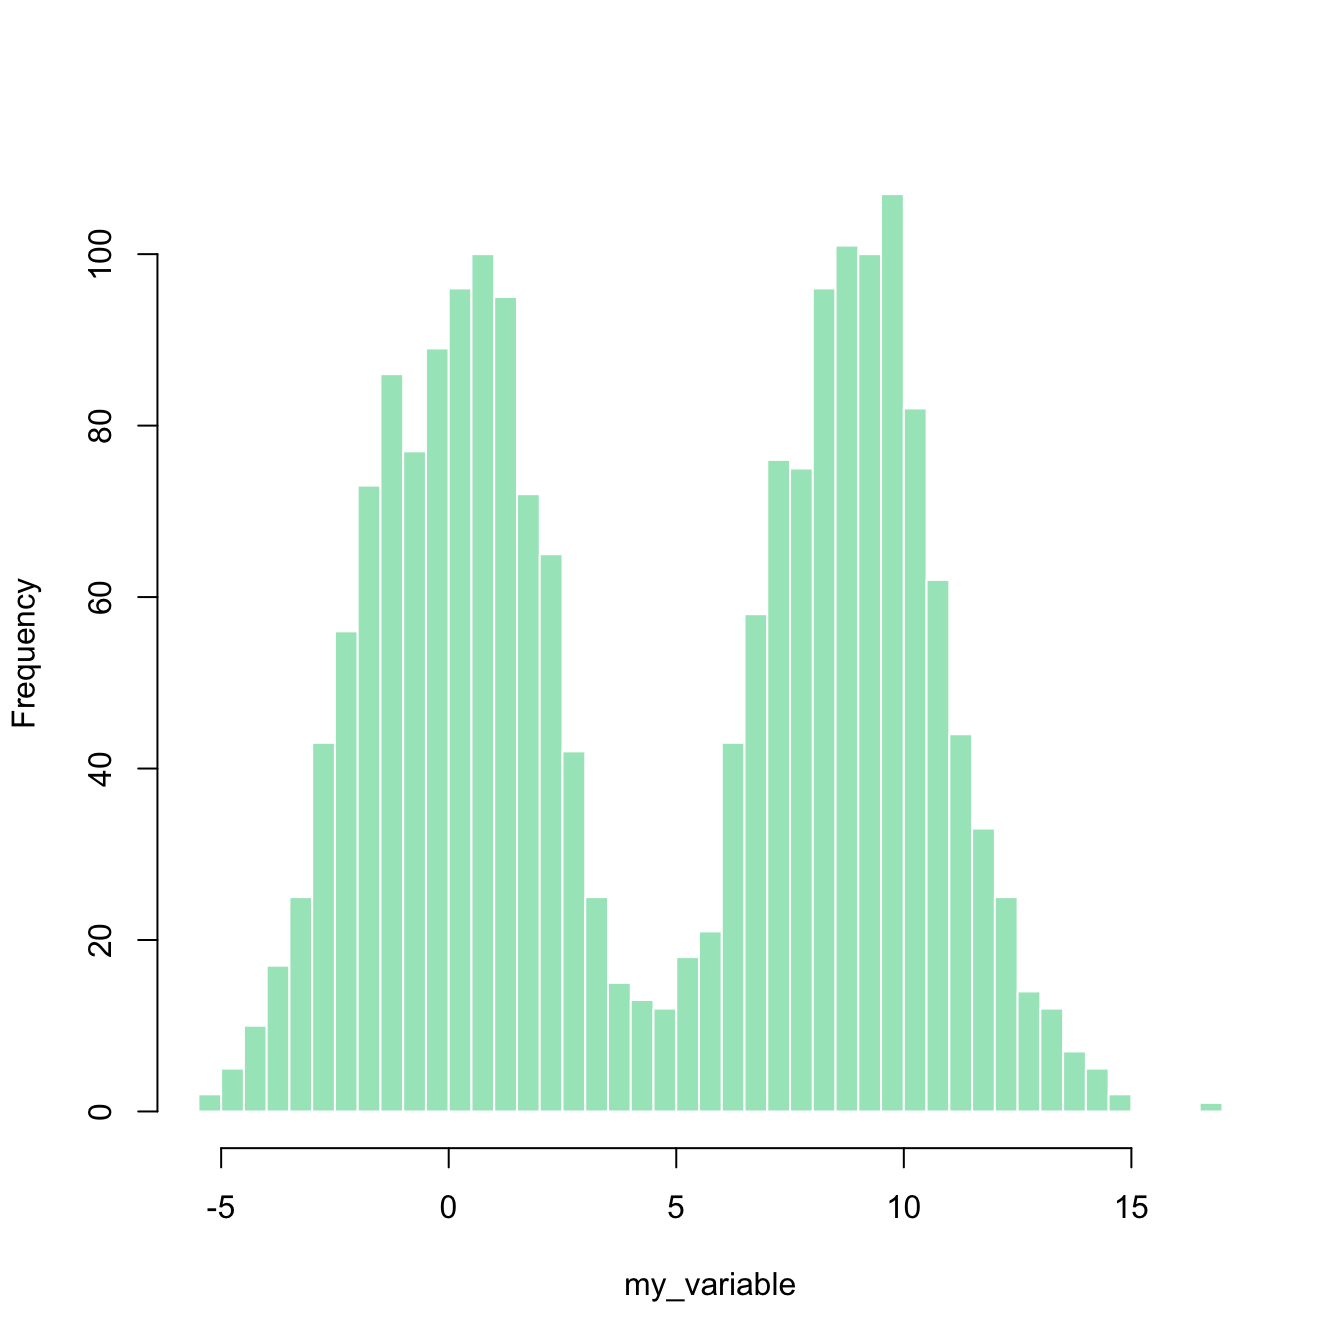
This posts explains how to get rid of histograms border in Basic R. It is purely about appearance preferences.

Histogram Section About histogram

Basically, you just need to add border=F to the hist function to remove the border of histogram bars.

# Create data 
my_variable=c(rnorm(1000 , 0 , 2) , rnorm(1000 , 9 , 2))
 
# Draw the histogram with border=F
hist(my_variable , breaks=40 , col=rgb(0.2,0.8,0.5,0.5) , border=F , main="")

Related chart types


Violin
Density
Histogram
Boxplot
Ridgeline


Contact

This document is a work by Yan Holtz. Any feedback is highly encouraged. You can fill an issue on Github, drop me a message on Twitter, or send an email pasting yan.holtz.data with gmail.com.

Github Twitter