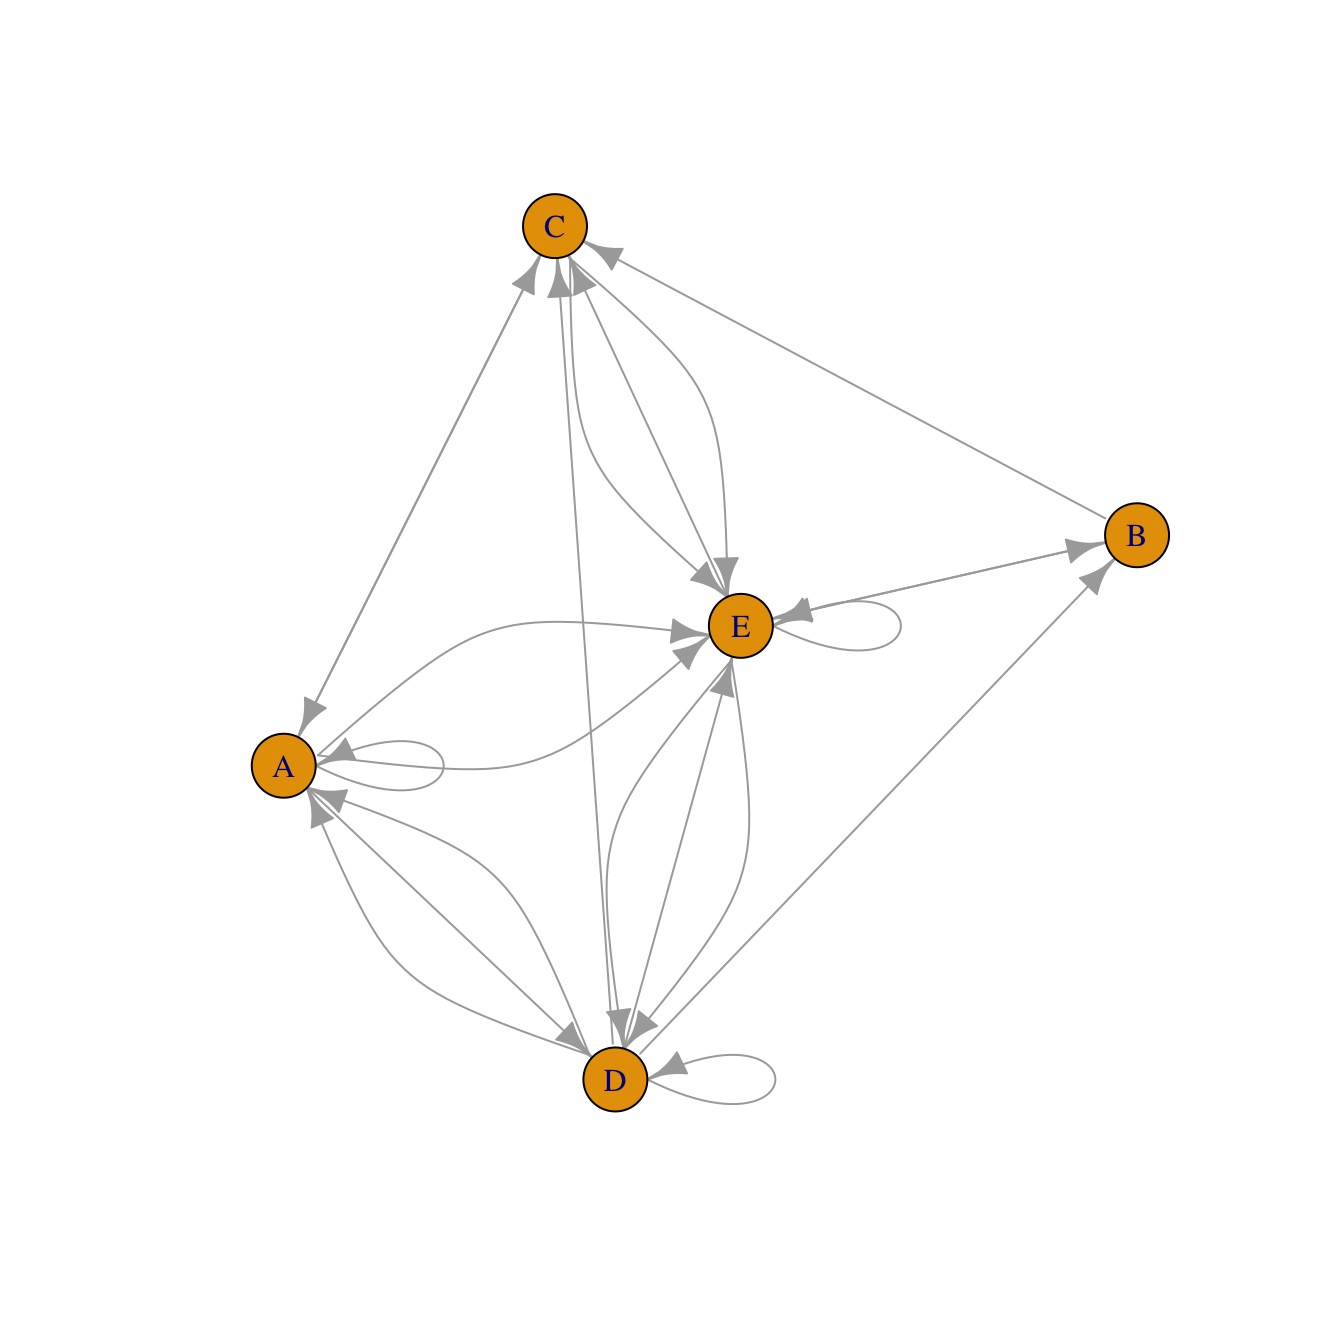
Adjacency matrix
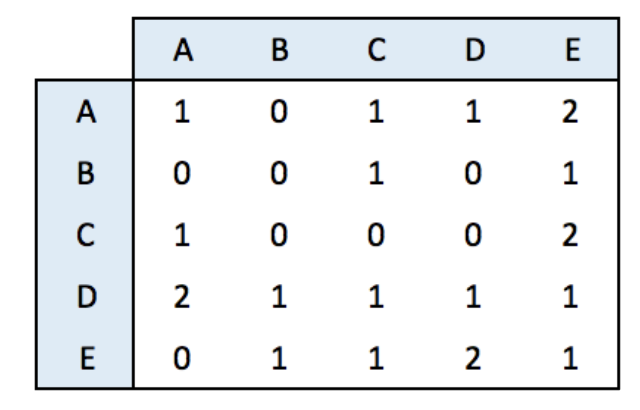
An adjacency matrix is a square matrix where individuals in rows and columns are the same.
It’s typically the kind of matrix you get when calculating the correlation between each pair of individual. In this example, we have 1 connection from E to C, and 2 connections from C to E. By default, we get an unweighted and oriented network.
#library
library(igraph)
# Create data
set.seed(10)
data <- matrix(sample(0:2, 25, replace=TRUE), nrow=5)
colnames(data) = rownames(data) = LETTERS[1:5]
# build the graph object
network <- graph_from_adjacency_matrix(data)
# plot it
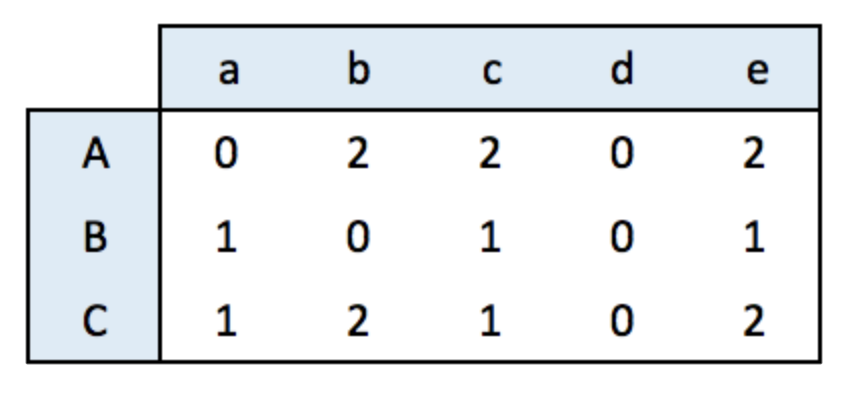
plot(network)Incidence matrix
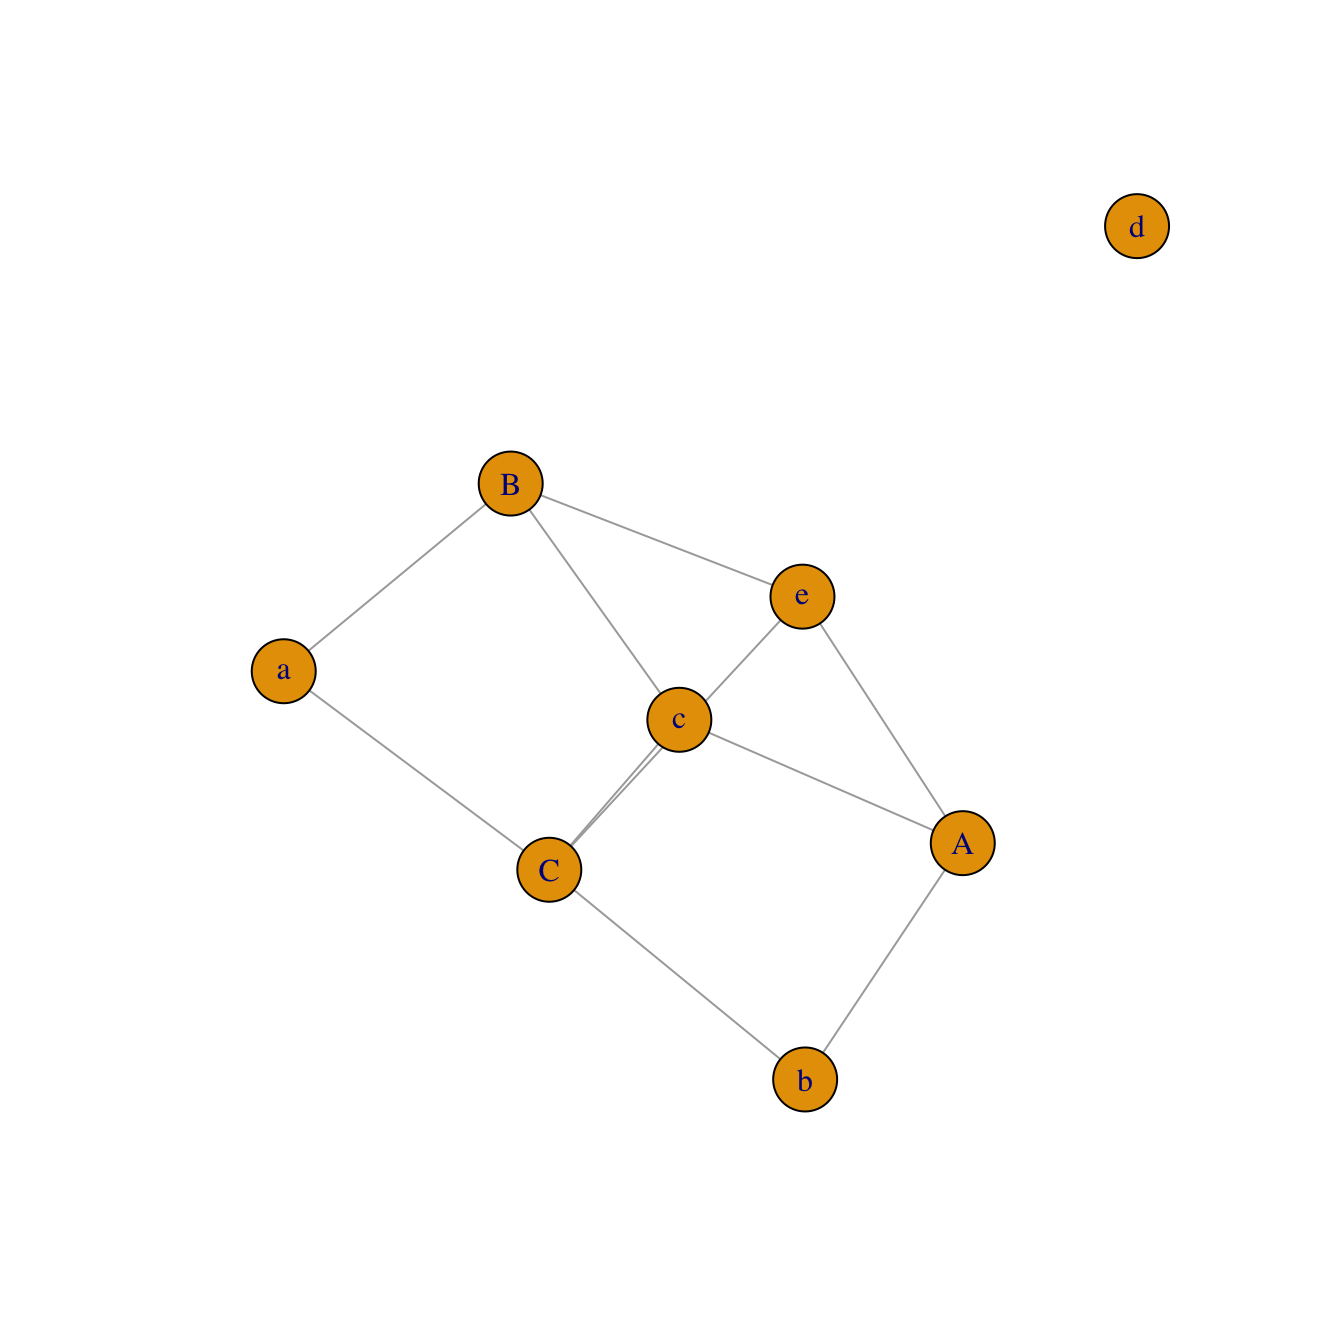
An incidence matrix is not square and entities provided in rows and columns are not necessary the same.
Note: by default, the graph object is directed from rows to columns.
# lib
library(igraph)

# data
set.seed(1)
data <- matrix(sample(0:2, 15, replace=TRUE), nrow=3)
colnames(data) <- letters[1:5]
rownames(data) <- LETTERS[1:3]

# create the network object
network <- graph_from_incidence_matrix(data)

# plot it
plot(network)
Edge list
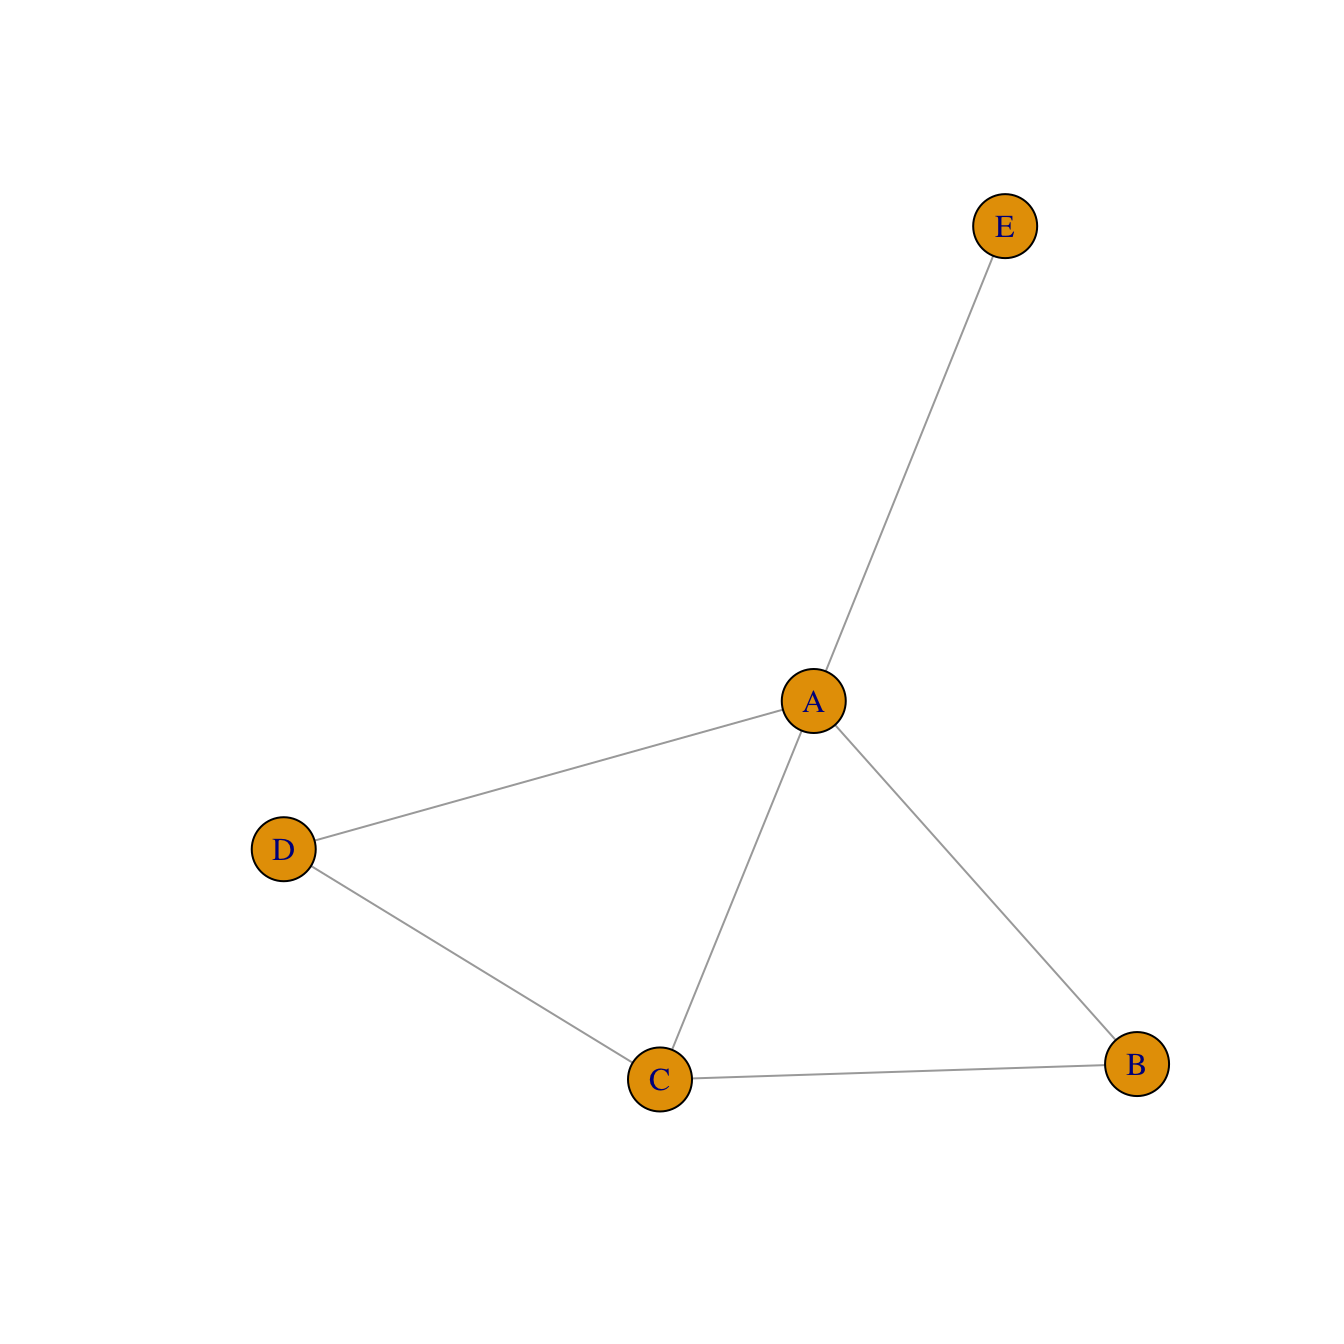
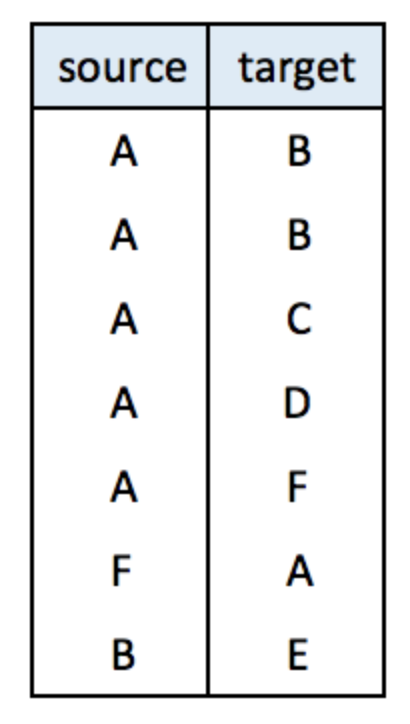
An edge list has 2 columns. Each row represents a connection between an origin (first column) and a destination (left column).
Note: this kind of input often goes with another dataframe providing features for each node. (See this post). It is also possible to add information concerning each link in the edge list.
# create data:
links <- data.frame(
source=c("A","A", "A", "A", "A","F", "B"),
target=c("B","B", "C", "D", "F","A","E")
)
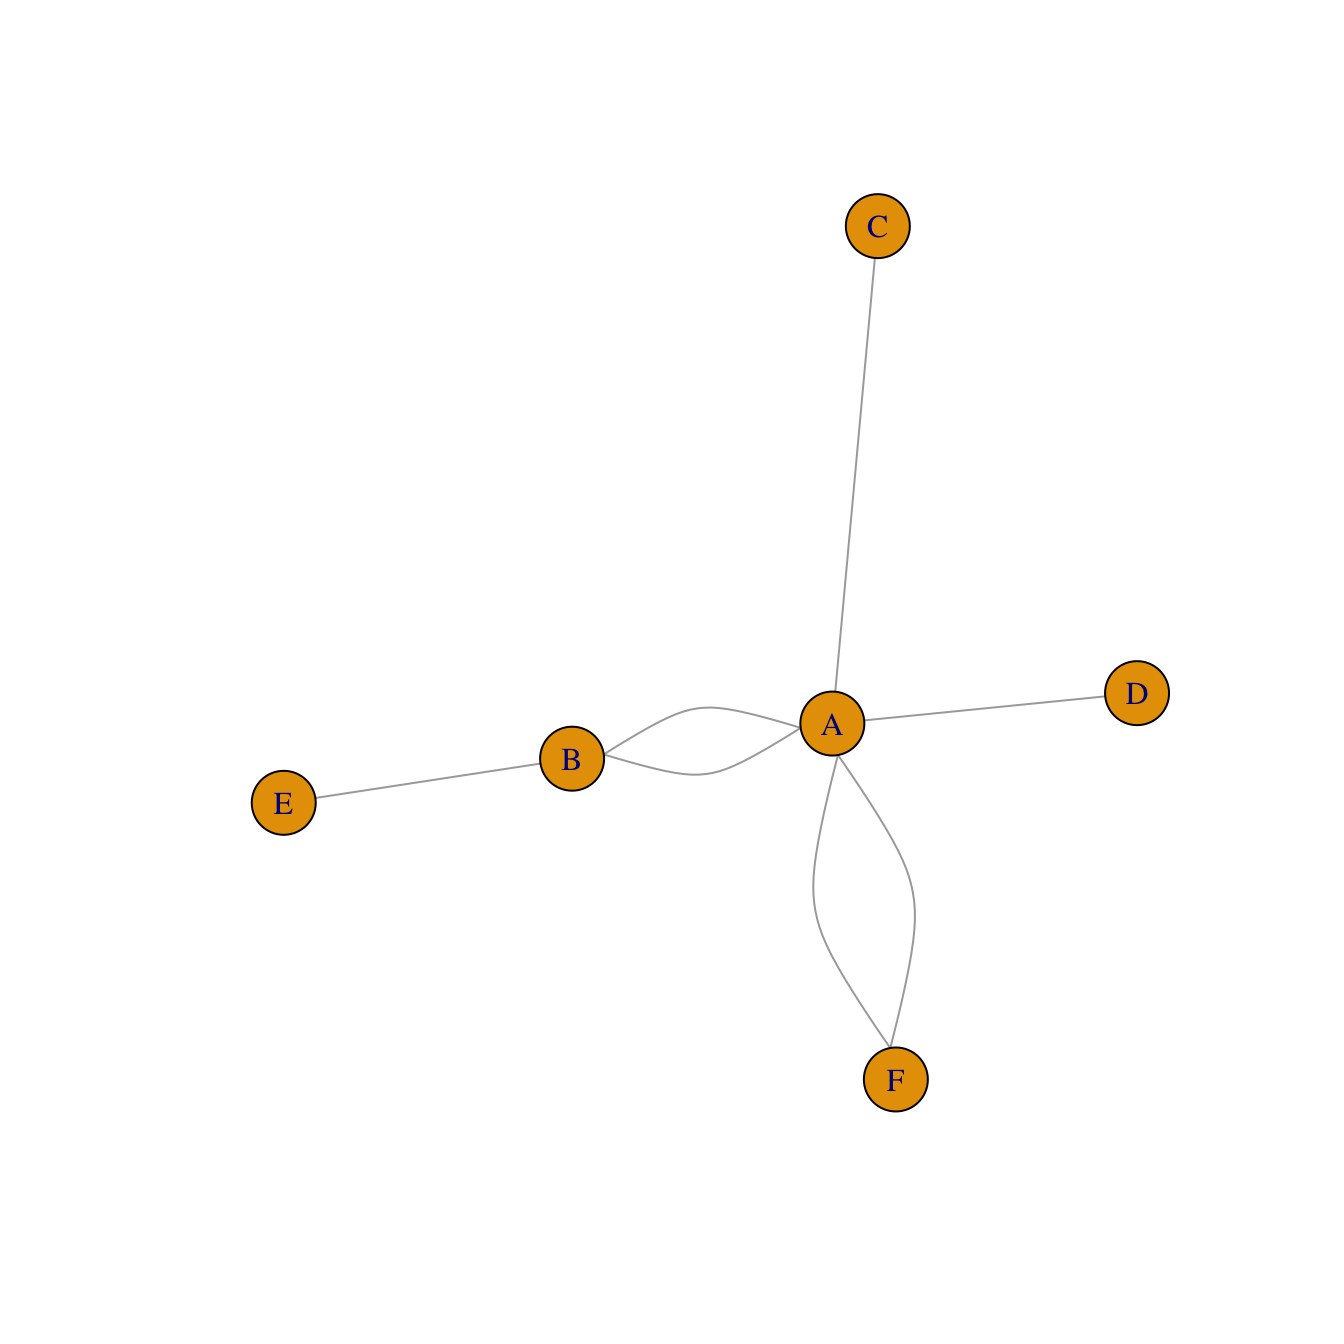
# create the network object
network <- graph_from_data_frame(d=links, directed=F)
# plot it
plot(network)Literal List of connections
Last option that is less often used: a litteral list of the connection. Can be understand by igraph thanks to the graph_from_literal() function.