Basic ggplot2 boxplot


A boxplot summarizes the distribution of a continuous variable. It displays its median, its first and third quartiles and its outliers. Main caveat is that the underlying distribution is hidden. This page explains how to build a basic boxplot with ggplot2.

Boxplot Section Boxplot pitfalls

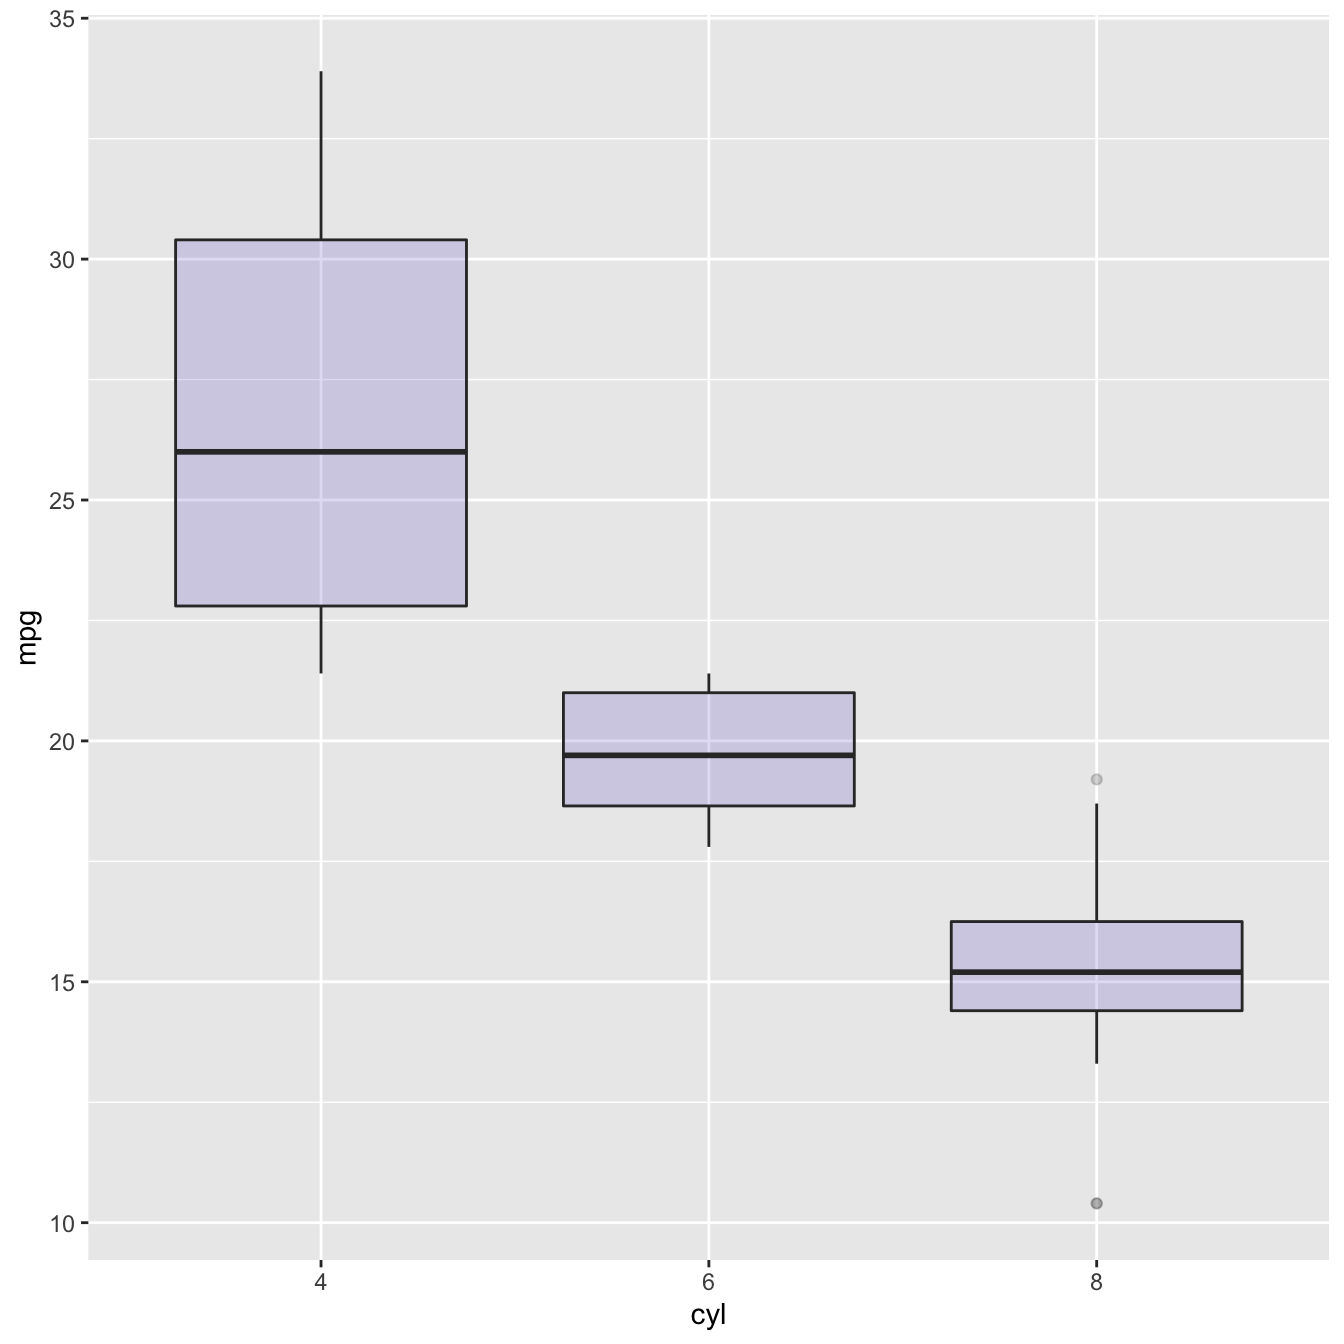
The ggplot2 library allows to make a boxplot using geom_boxplot(). You have to specify a quantitative variable for the Y axis, and a qualitative variable for the X axis ( a group).

# Load ggplot2
library(ggplot2)
 
# The mtcars dataset is natively available
# head(mtcars)
 
# A really basic boxplot.
ggplot(mtcars, aes(x=as.factor(cyl), y=mpg)) + 
    geom_boxplot(fill="slateblue", alpha=0.2) + 
    xlab("cyl")

Related chart types


Violin
Density
Histogram
Boxplot
Ridgeline


Contact

This document is a work by Yan Holtz. Any feedback is highly encouraged. You can fill an issue on Github, drop me a message on Twitter, or send an email pasting yan.holtz.data with gmail.com.

Github Twitter