Most basic dendrogram with R
→ Input dataset is a matrix where each row is a sample,
and each column is a variable. Keep in mind you can transpose a
matrix using the t() function if needed.
→ Clustering is performed on a square matrix (sample x sample) that
provides the distance between samples. It can be computed using the
dist() or the cor() function depending on
the question your asking
→ The hclust() function is used to perform the
hierarchical clustering
→ Its output can be visualized directly with the
plot() function. See possible
customization.
# Dataset
data <- matrix( sample(seq(1,2000),200), ncol = 10 )
rownames(data) <- paste0("sample_" , seq(1,20))
colnames(data) <- paste0("variable",seq(1,10))
# Euclidean distance
dist <- dist(data[ , c(4:8)] , diag=TRUE)
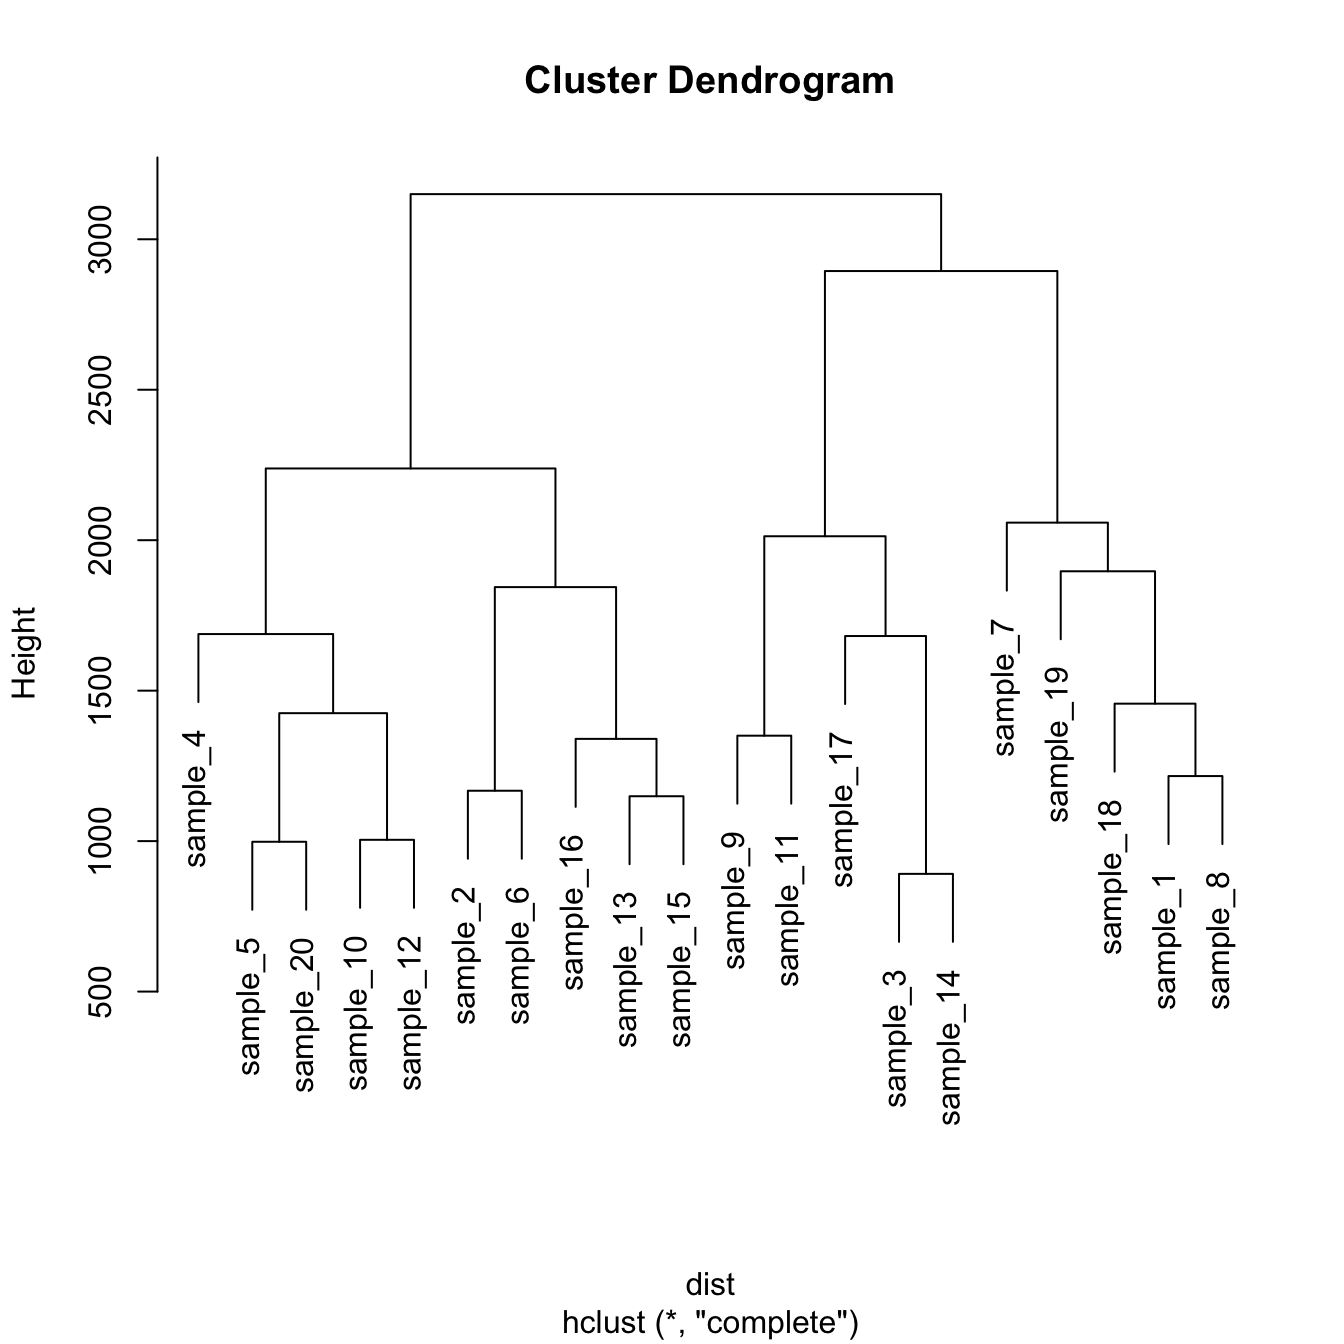
# Hierarchical Clustering with hclust
hc <- hclust(dist)
# Plot the result
plot(hc)Hierarchical clustering principle:
- Take distances between objects.
- Seek the smallest distance between 2 objects.
- Aggregate the 2 objects in a cluster.
- Replace them with their barycenter. → Again until having only one cluster containing every points.
There are several ways to calculate the distance between 2 clusters ( using the max between 2 points of the clusters, or the mean, or the min, or ward (default) ).
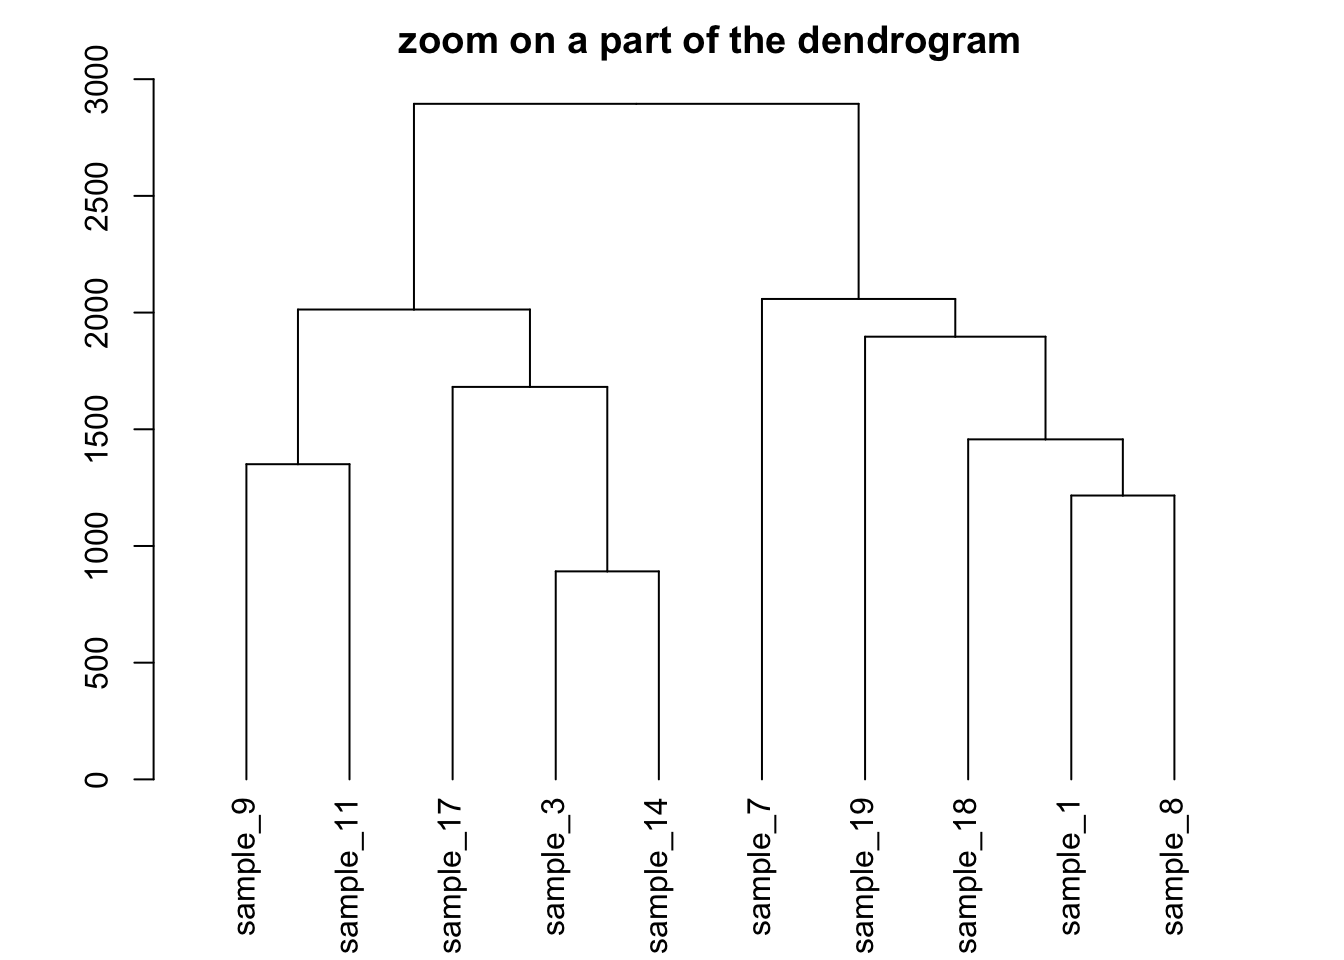
Zoom on a group
It is possible to zoom on a specific part of the tree. Select the
group of interest using the [[..]] operator:
# store the dedrogram in an object
dhc <- as.dendrogram(hc)

# set the margin
par(mar=c(4,4,2,2))

# Plot the Second group
plot(dhc[[2]] , main= "zoom on a part of the dendrogram")