Scatterplot matrix with ggpairs()
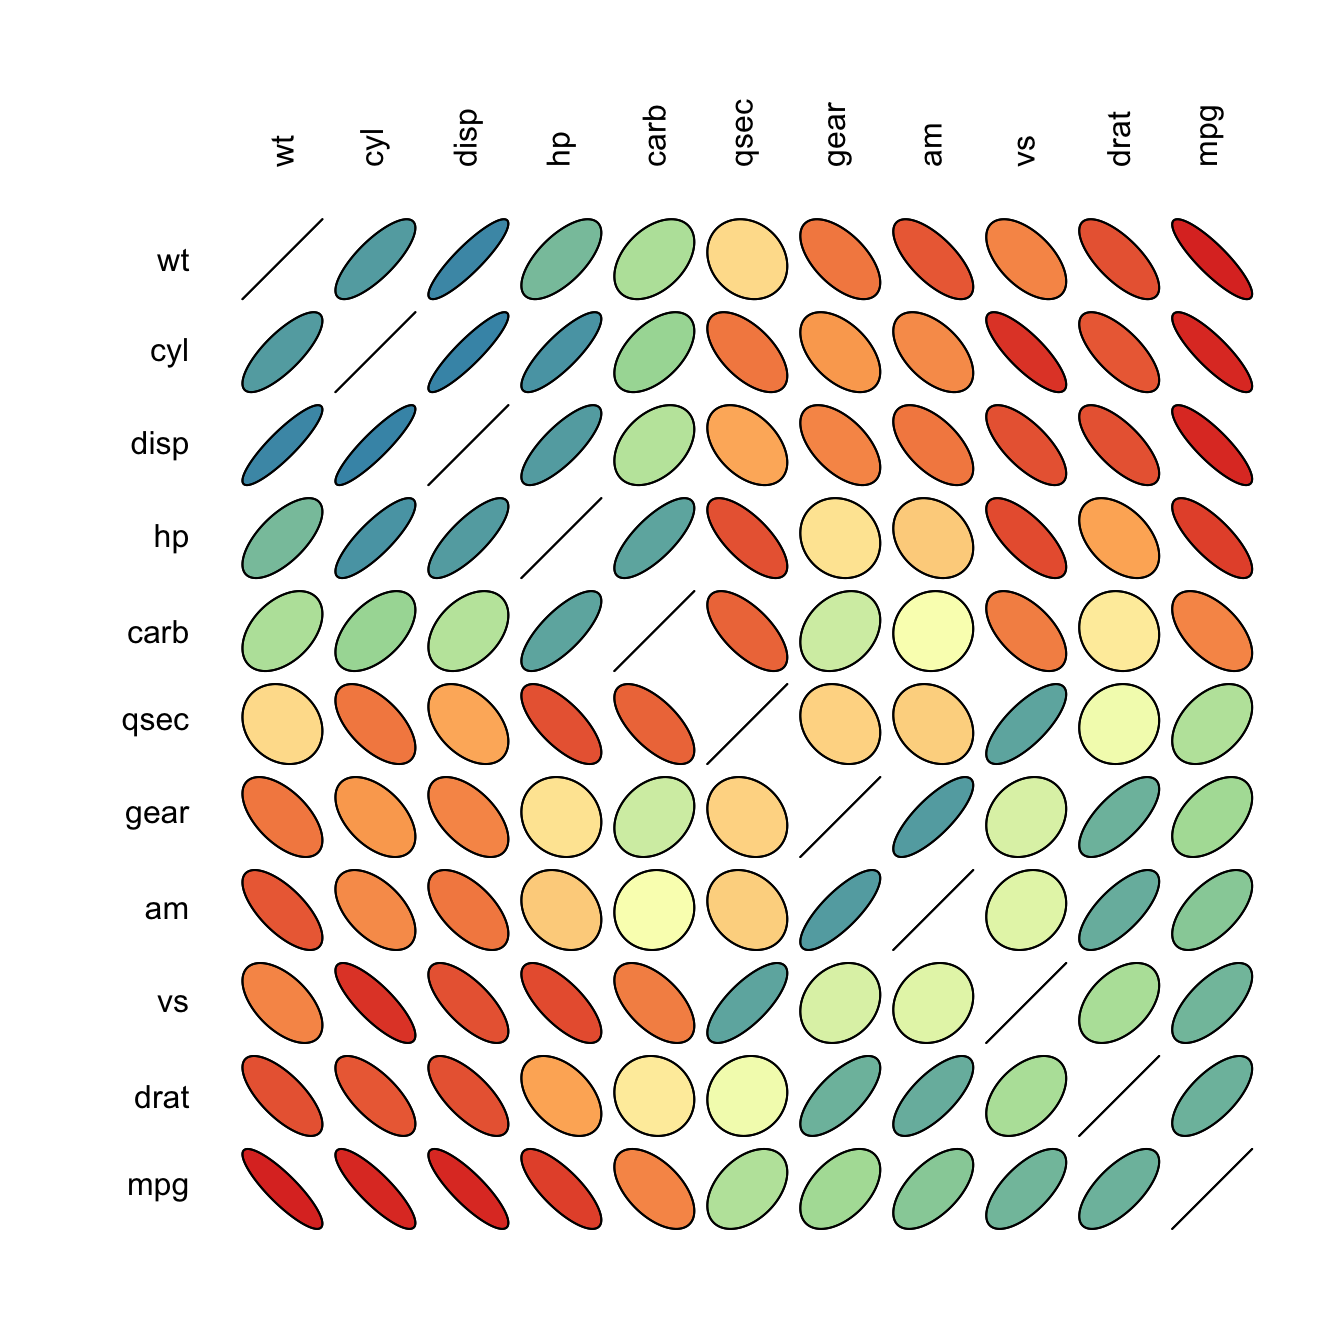
The ellipse package allows to build a correlogram
thanks to the plotcorr() function.
First of all, you have to compute the correlation matrix of your
dataset using the cor() function of R. Each
correliation will be represented as an ellipse by the
plotcorr() function. Color, shape and orientation
depend on the correlation value.
# Libraries
library(ellipse)
library(RColorBrewer)

# Use of the mtcars data proposed by R
data <- cor(mtcars)

# Build a Pannel of 100 colors with Rcolor Brewer
my_colors <- brewer.pal(5, "Spectral")
my_colors <- colorRampPalette(my_colors)(100)

# Order the correlation matrix
ord <- order(data[1, ])
data_ord <- data[ord, ord]
plotcorr(data_ord , col=my_colors[data_ord*50+50] , mar=c(1,1,1,1)  )


