Basic scatterplot matrix


This post explains how to build a scatterplot matrix with base R, without any packages. It provides several reproducible examples with explanation and R code.

Correlogram section Data to Viz

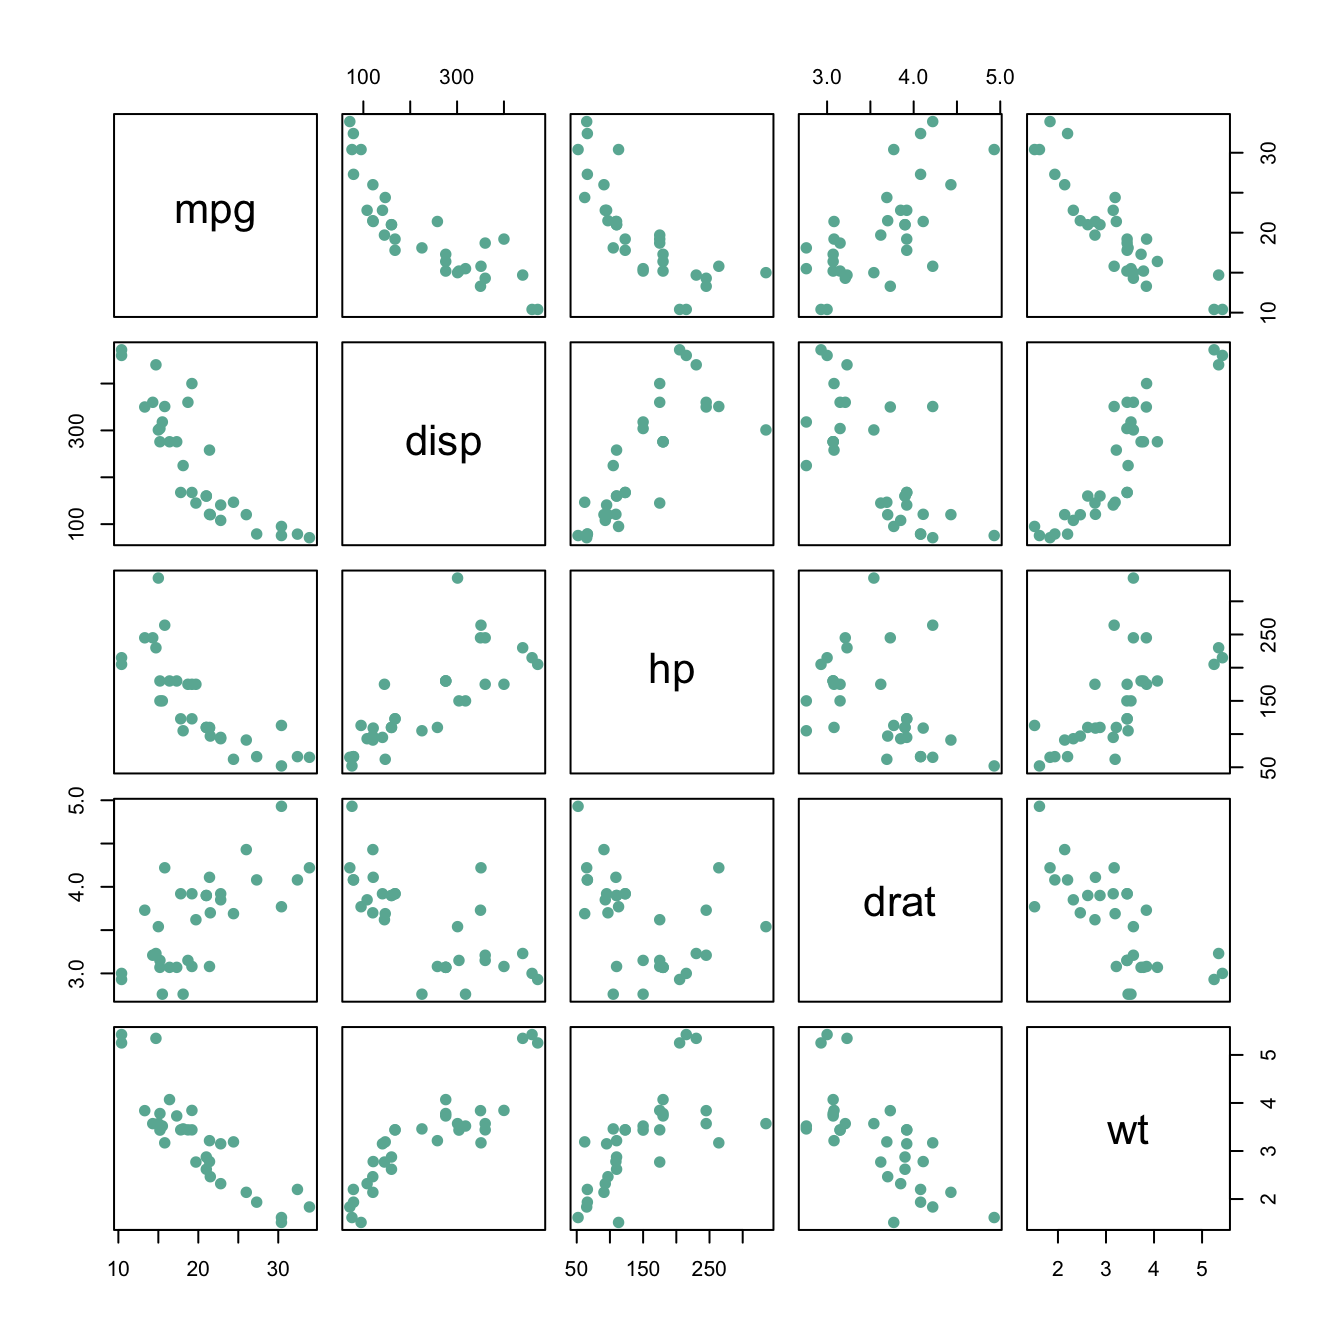
Scatterplot matrix with the native plot() function


For a set of data variables (dimensions) X1, X2, ??? , Xk, the scatter plot matrix shows all the pairwise scatterplots of the variables on a single view with multiple scatterplots in a matrix format.

The native plot() function does the job pretty well as long as you just need to display scatterplots. For more option, check the correlogram section

# Data: numeric variables of the native mtcars dataset
data <- mtcars[ , c(1,3:6)]
 
# Plot
plot(data , pch=20 , cex=1.5 , col="#69b3a2")

Related chart types


Scatter
Heatmap
Correlogram
Bubble
Connected scatter
Density 2d


Contact

This document is a work by Yan Holtz. Any feedback is highly encouraged. You can fill an issue on Github, drop me a message on Twitter, or send an email pasting yan.holtz.data with gmail.com.

Github Twitter