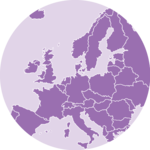
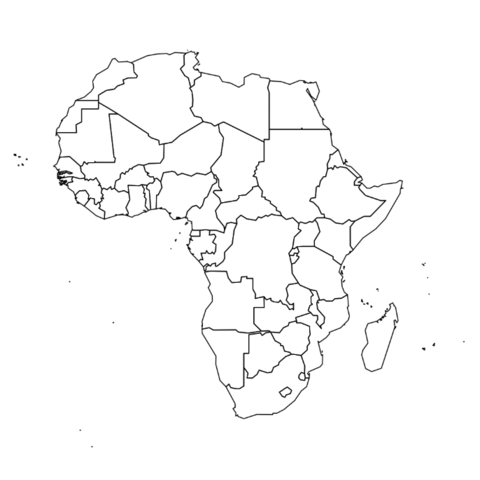
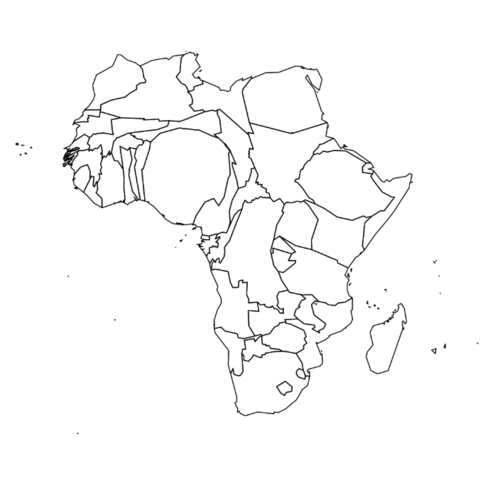
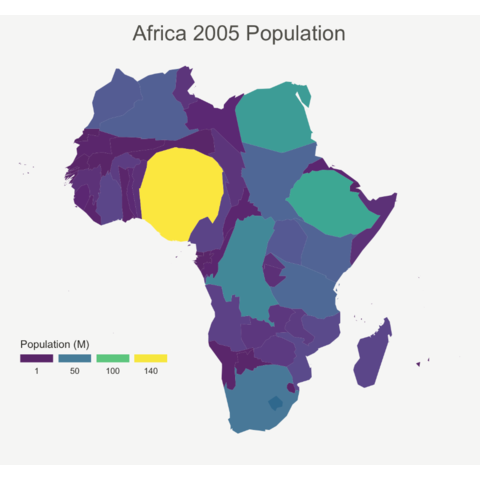
cartogram package: step by stepThe cartogram package allows to build cartograms in R. It requires a geospatial object as input, with a numeric variable in the data slot. This variable will be used to distort region shape. The following example will guide you through the process:
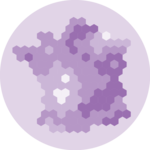
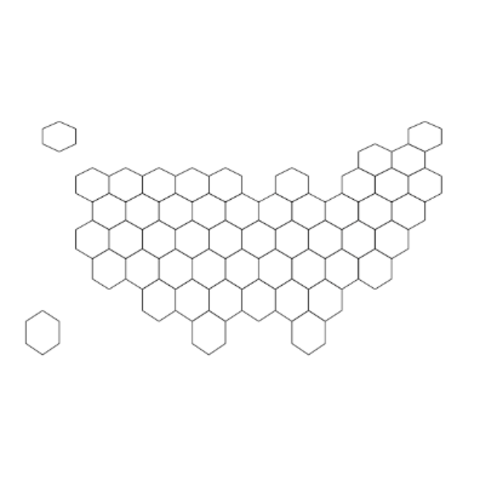
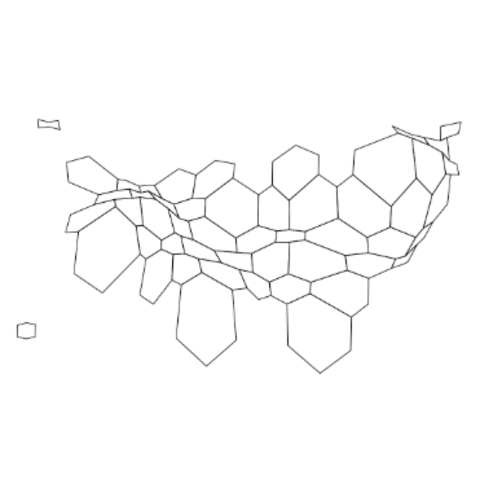
A hexbin map is a map where each region is represented as an hexagon. It is possible to apply a cartogram algorithm to such a map, as suggested in the example below. Note that you probably want to explore the hexbin map section before making a cartogram with it.
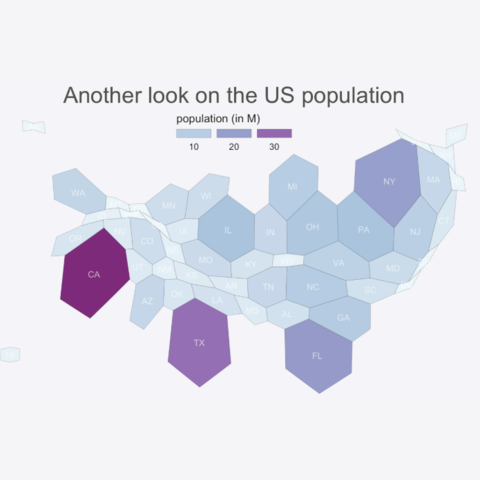
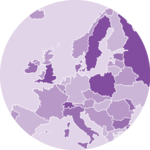
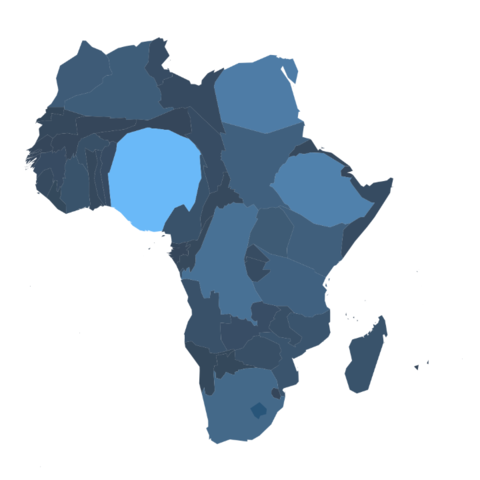
The following example describes extensively how to make a smooth transition between a choropleth map and a cartogram. This is possible thanks to the tweenR and the gganimate libraries. See the explanations here. See the animation section for more examples of animation with R.