Dealing with colors in base R


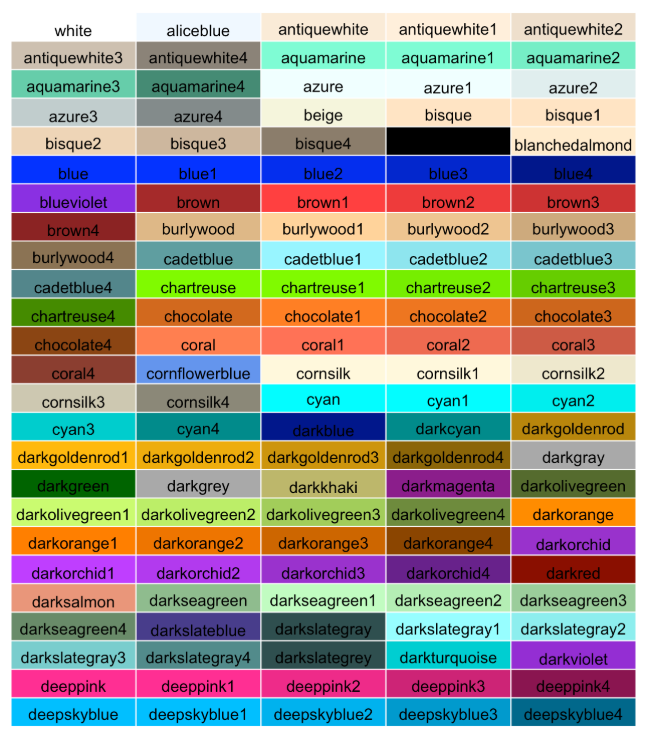
Color is one of the most important component of a data visualization.

R offers some awesome functions to deal with it. This post should guide you through
the basics, from calling a single color to building a neat color palette.

Note however that dealing with color is much simpler using ggplot2, and that the gallery
offers a dedicated section to color management with ggplot2.
Picking one color with R


There are 5 main methods to call a color in R. Click the buttons below to see a description of them

Name rgb() Number Hex code

Name → The most common method is to call a color by its name. R offers about 657 color names. You can read all of them using colors().

Read more
ggplot2 theme
Build a color palette with RColorBrewer

RColorBrewer is the most famous package when it comes to build color palette with R. It provides quality continuous, sequential and categorical color palette. Examples below should get you started with this package, and give you an overview of all the available color palettes.

Other palette: use paletteer

The paletteer package gives access to all the existing color palettes in R.

Set color according to a variable in base R

Once you've found a color palette you like, you probably need to map it to a categorical or a numeric variable. This pretty easy to do with ggplot2, but much harder in base R. Basically, you have to transform the variable of interest in an integer that will be used to call the appropriate color.

Other base R examples involving colors

Related chart types


Ggplot2
Animation
3D
Caveats
Data art