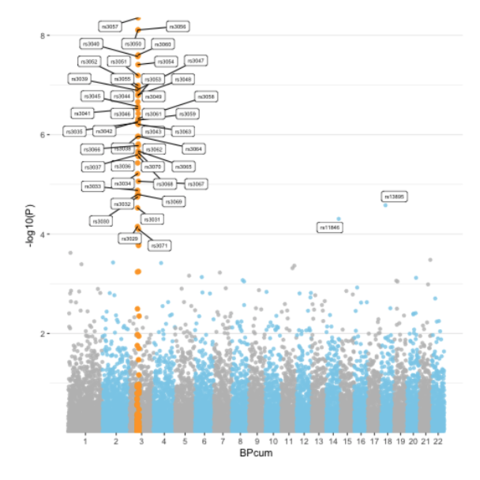
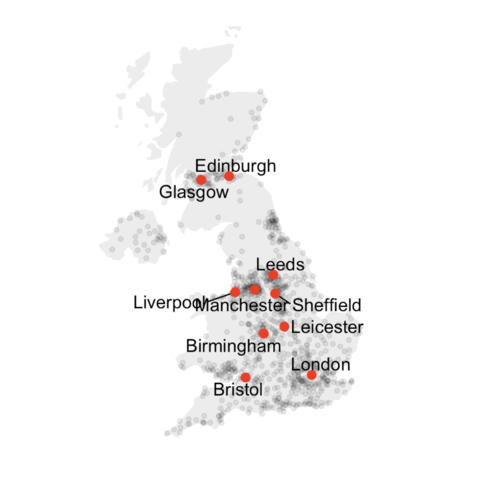
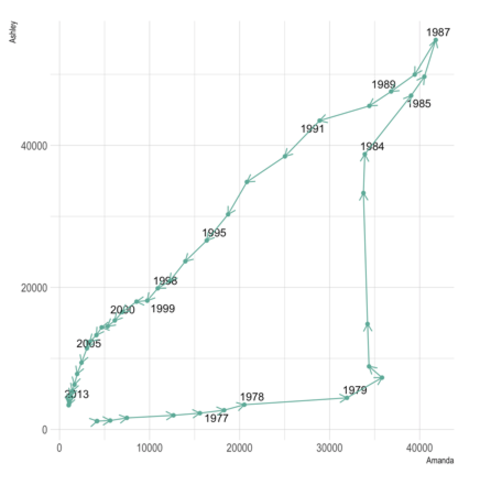
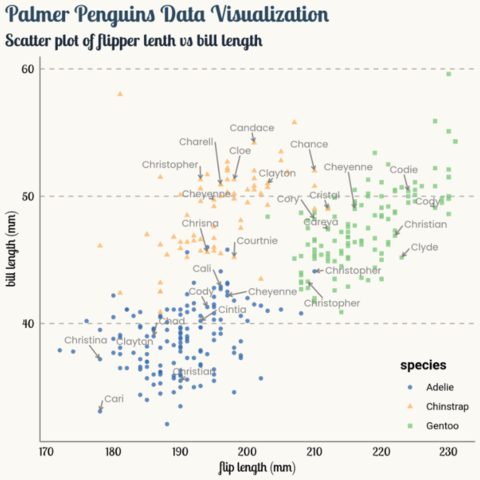
Avoid overlapping text with ggrepel


This post explains how to avoid overlapped text with automatic positioning in ggplot2 plots using the ggrepel package.
This post showcases the key features of ggrepel and provides a set of graph examples using the package.

Documentation

{ggrepel}

Quick start


The ggrepel package in R is an extension of the ggplot2 package, designed to simplify the process of avoiding overlapped texts in plots.

It offers 2 main functions: geom_text_repel() and geom_label_repel()

✍️ author → Kamil Slowikowski

📘 documentationgithub

⭐️ more than 1000 stars on github

Installation


To get started with ggrepel, you can install it directly from CRAN using the install.packages function:

install.packages("ggrepel")

Basic usage


The ggrepel package allows you to display labels using a single geom and invert the functions geom_text_repel() and geom_label_repel() without constraint:

Here’s a basic example:

library(ggplot2)
library(ggrepel)
data(iris)

ggplot(iris, aes(Sepal.Width, Sepal.Length, label=Species, color=Species)) +
  geom_text_repel()

Key features


→ Combining scatter plot with labels

You can labels on individual data points with the geom_label_repel() function. All points will not be displayed if there is not enough room for them, but you can force it with the max.overlaps argument (check below).

Example:

library(ggplot2)
library(ggrepel)
data(iris)

ggplot(iris, aes(Sepal.Width, Sepal.Length, label=Species, color=Species)) +
  geom_label_repel() +
  geom_point() + 
  theme_classic(base_size = 16) +
  theme(legend.position = "none") 

→ Display only some specific labels

The easiest way to display only some labels is to create a new column on your dataframe with a non-empty value only for the observations you’re interested in.

Example:

# Create a new columns with the label only for row 2,3 and 14
mtcars$car = ""
idx_to_label = c(2, 20, 14)
mtcars$car[idx_to_label] = rownames(mtcars)[idx_to_label]

# Display the result
ggplot(mtcars, aes(wt, mpg, label = car)) +
  geom_text_repel() +
  geom_point(color = ifelse(mtcars$car == "", "grey50", "red"))

→ For maximum overlapping

The geoms provided by ggrepel try do avoid as much as possible overlapping, with a maximum of 10 by default. However, you can change this value if overlapping is not a problem for you with the max.overlaps argument!

Example:

library(ggplot2)
library(ggrepel)
data(iris)

ggplot(iris, aes(Sepal.Width, Sepal.Length, label=Species, color=Species)) +
  geom_text_repel(max.overlaps=nrow(iris)) + # ensure all data points are displayed
  geom_point() + 
  theme_classic(base_size = 10) +
  theme(legend.position = "none") 

→ Parallel coordinates plot

Parallel coordinates plot are easy to create with ggrepel combined with the geom_segement() function from ggplot2

Example:

library(hrbrthemes)
df = data.frame(x1 = 1,
                y1 = rnorm(10),
                x2 = 2,
                y2 = rnorm(10),
                lab = state.name[1:10])

ggplot(df, aes(x1, y1, xend = x2, yend = y2, label = lab, col = lab)) +
  geom_segment(size = 0.5) +
  guides(color = "none") + # remove legend
  theme_bw() + # change background color and overall theme
  geom_text_repel(nudge_x = -0.2, direction = "y", hjust = "right") +
  geom_text_repel(aes(x2, y2), nudge_x = 0.1, direction = "y", hjust = "left")

→ Change label style properties

Thanks to the color, bg.color and bg.r, you can change colors of your labels.

Example:

mtcars$car = rownames(mtcars)

ggplot(mtcars, aes(wt, mpg, label = car)) +
  geom_point(color = "red") +
  geom_text_repel(color = "white",     # text color
                  bg.color = "grey30", # shadow color
                  bg.r = 0.12)          # shadow radius


Contact

This document is a work by Yan Holtz. Any feedback is highly encouraged. You can fill an issue on Github, drop me a message on Twitter, or send an email pasting yan.holtz.data with gmail.com.

Github Twitter