About
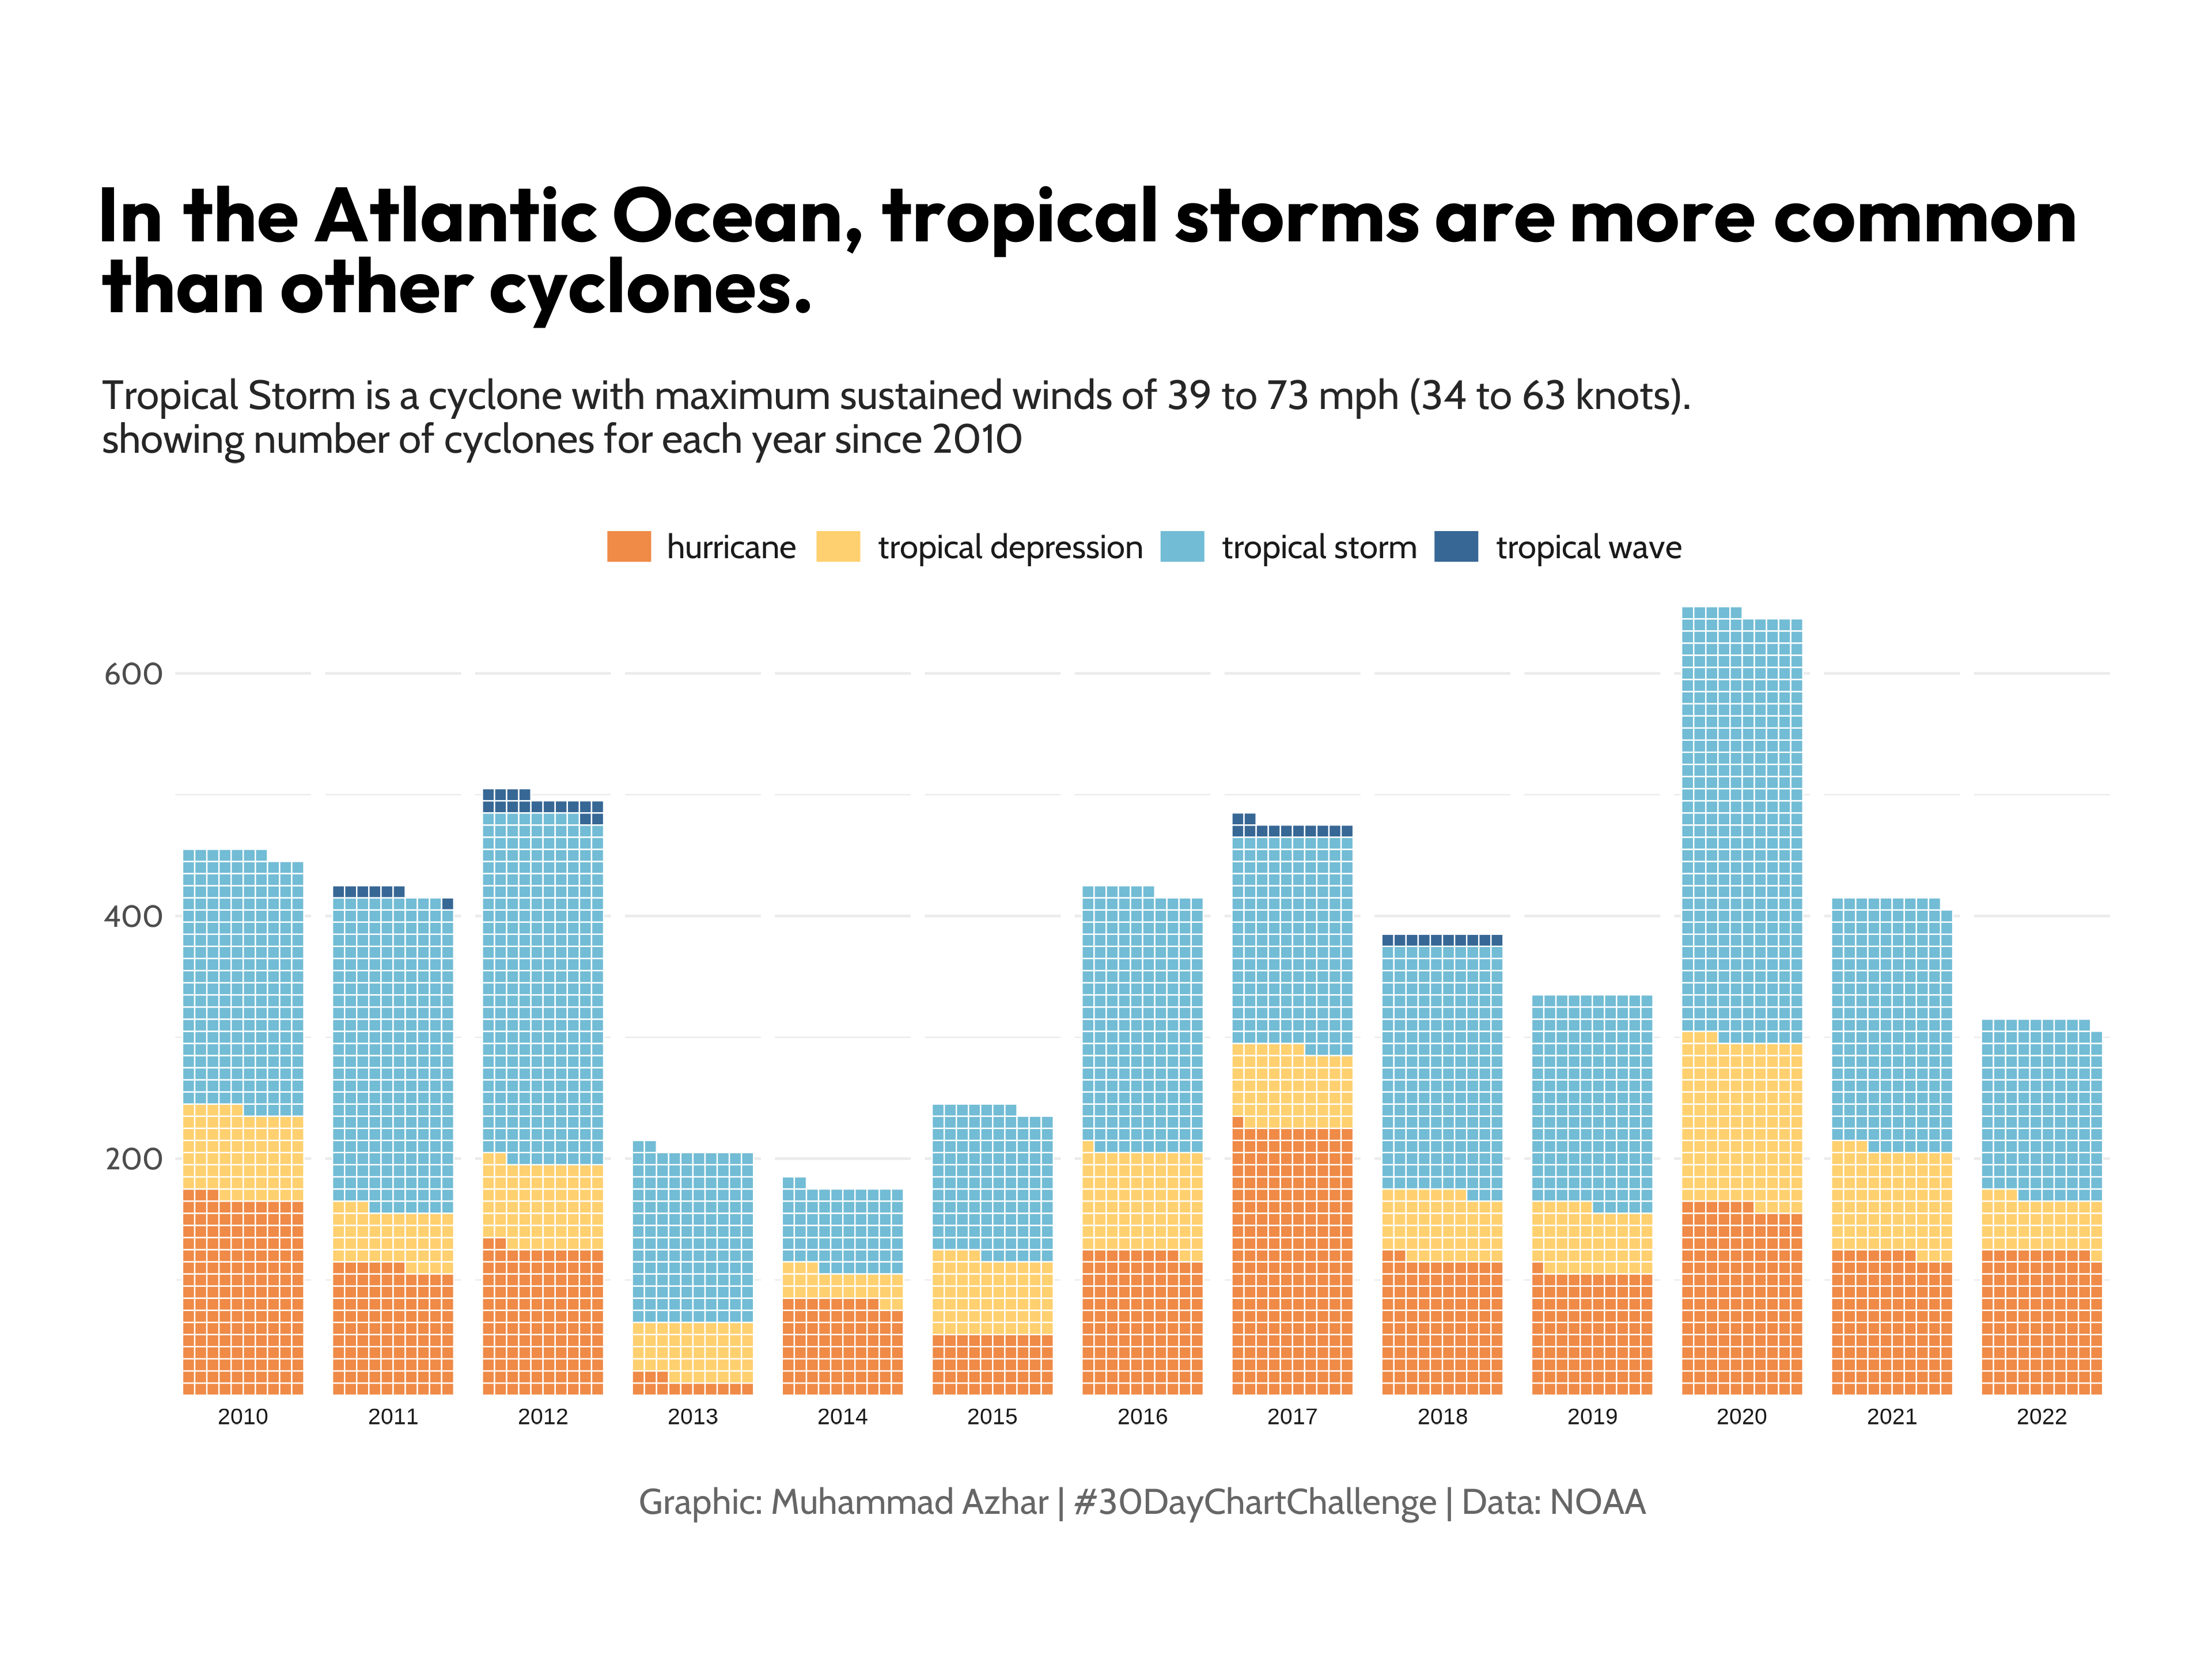
The chart we want to reproduce is a waffle chart about the number of storms in the Atlantic Ocean.
It has been created by Muhammad Azhar. Thanks to him for accepting sharing his work here!
As a teaser, here’s the chart we want to reproduce:
Libraries
In order to create this chart, we will use the following libraries:
Data
The data is the storms dataset, available when loading
the tidyverse library. It contains information about
storms in the Atlantic Ocean.
From this dataset, we will:
- Filter the data to keep only the storms since 2010
-
Keep only the storms with the status
hurricane,tropical depression,tropical storm, andtropical wave - Count the number of storms for each year and status
storms_df <- storms|>
  filter(year >= 2010,
         status %in% c("hurricane", "tropical depression",
                       "tropical storm","tropical wave"))|>
  count(year, status)
Then we define the fonts and the texts that will be used in the chart:
font_add_google("Outfit", "title_font")
font_add_google("Cabin", "body_font")
showtext_auto()

title_font <- "title_font"
body_font <- "body_font"

title_text <- "In the Atlantic Ocean, tropical storms are more common than other cyclones."
subtitle_text <- "Tropical Storm is a cyclone with maximum sustained winds of 39 to 73 mph (34 to 63 knots).\nshowing number of cyclones for each year since 2010"
caption_text <- "Graphic: Muhammad Azhar | #30DayChartChallenge | Data: NOAA"
Waffle chart for time series
Waffle chart can be used for various cases such distribution plot or time series.
In this case, we use it as a time series plot for displaying the number of storms, per year, with different statuses.
p = ggplot(storms_df, aes(fill = status, values = n)) +
  geom_waffle(color = "white", size = .25, n_rows = 10, flip = TRUE) +
  facet_wrap(~year, nrow = 1, strip.position = "bottom") +
  scale_x_discrete() +
  scale_y_continuous(labels = function(x) x * 10, # make this multiplyer the same as n_rows
                     expand = c(0,0))+
  MetBrewer::scale_fill_met_d("Hiroshige", direction=1)+
  coord_equal()+
  labs(title = title_text,
       subtitle = subtitle_text,
       caption = caption_text)+
  theme_minimal()+
  theme(
    axis.title = element_blank(),
    axis.text.x = element_text(family = body_font, size=12),
    axis.text.y = element_text(family = body_font, size=12),
  # Legend
  legend.position = "top",
  legend.title = element_blank(),
  legend.spacing = unit(0.5, 'cm'),
  legend.key.height= unit(0.5, 'cm'),
  legend.key.width= unit(0.7, 'cm'),
  legend.text = element_text(family = body_font,
                             size=13,
                             face = 'plain',
                             color = "grey10"),

  # TITLE
  plot.title.position = "plot",
  plot.title = element_textbox(margin = margin(20, 0, 10, 0),
                               size = 30,
                               family = title_font,
                               face = "bold",
                               width = unit(55, "lines")),

  # SUB-TITLE
  plot.subtitle = element_text(margin = margin(10, 0, 20, 0),
                            size = 16,
                            family = body_font,
                            color = "grey15"),
  # Caption
  plot.caption = element_text(family=body_font,
                              face="plain",
                              size=14,
                              color="grey40",
                              hjust=.5,
                              margin=margin(20,0,0,0)),

  plot.background = element_rect(color="white", fill="white"),
  plot.margin = margin(20, 40, 20, 40)
)

showtext_opts(dpi = 320)
ggsave(
  "img/graph/web-waffle-for-time-evolution.png",
  dpi=320, width = 12, height = 9
)
showtext_auto(FALSE)
Going further
This post explains how to create a waffle chart with nice features such as annotations, nice color theme and others, using R and ggplot2.
If you want to learn more, you can check the waffle section of the gallery and how to play with subgroups and colors in waffle charts.


