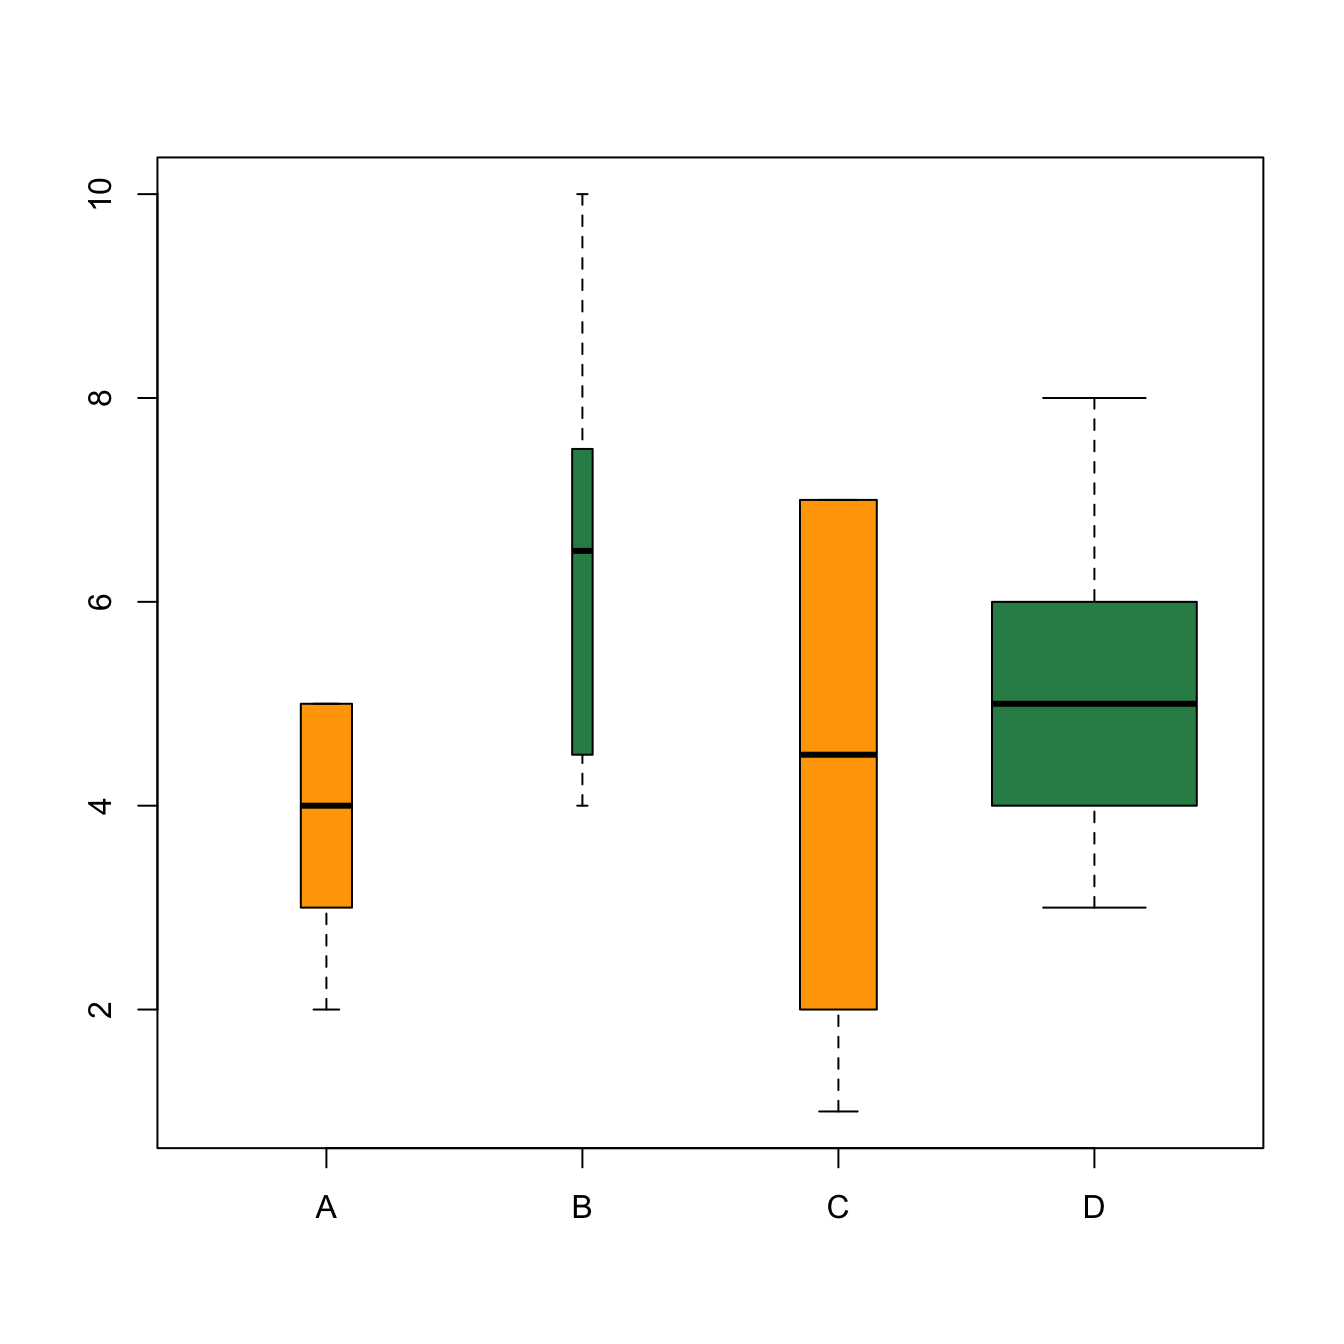
When the sample size behind each category is highly variable, it can be great to represent it through the box widths.
First calculate the proportion of each level using the
table() function. Using these proportions will make the
box twice bigger if a level is twice more represented. Then give
these proportions to the width argument when you call
the boxplot() function.
# Dummy data
names <- c(rep("A", 20) , rep("B", 8) , rep("C", 30), rep("D", 80))
value <- c( sample(2:5, 20 , replace=T) , sample(4:10, 8 , replace=T),
       sample(1:7, 30 , replace=T), sample(3:8, 80 , replace=T) )
data <- data.frame(names,value)


# Calculate proportion of each level
proportion <- table(data$names)/nrow(data)

#Draw the boxplot, with the width proportionnal to the occurence !
boxplot(data$value ~ data$names , width=proportion , col=c("orange" , "seagreen"))