The first challenge here is to recover the position of the top part
of each box. This is done by saving the
boxplot() result in an object (called
boundaries here). Now, typing
boundaries$stats gives a dataframe with all information
concerning boxes.
Then, it is possible to use the text function to add
labels on top of each box. This function takes 3 inputs:
- x axis positions of the labels. In our case, it will be 1,2,3,4 for 4 boxes.
-
y axis positions, available in the
boundaries$statsobject. - text of the labels : the number of value per group or whatever else.
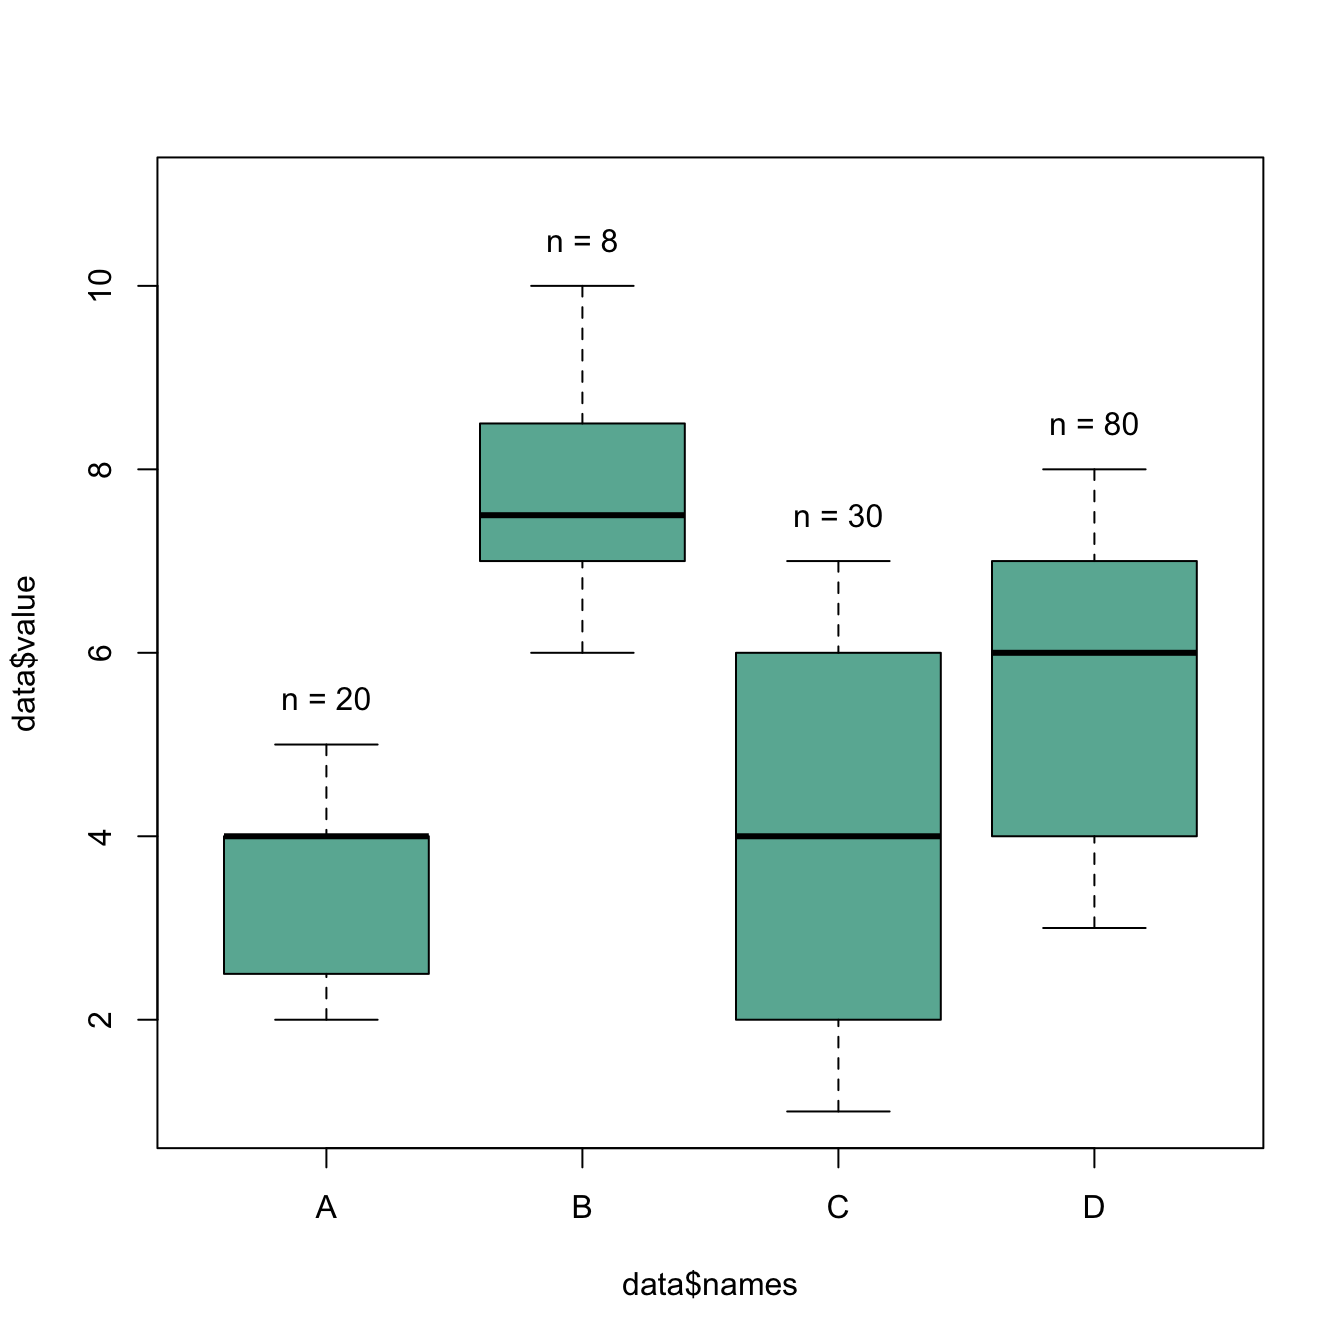
# Dummy data
names <- c(rep("A", 20) , rep("B", 8) , rep("C", 30), rep("D", 80))
value <- c( sample(2:5, 20 , replace=T) , sample(4:10, 8 , replace=T),
       sample(1:7, 30 , replace=T), sample(3:8, 80 , replace=T) )
data <- data.frame(names,value)

# Draw the boxplot. Note result is also stored in a object called boundaries
boundaries <- boxplot(data$value ~ data$names , col="#69b3a2" , ylim=c(1,11))
# Now you can type boundaries$stats to get the boundaries of the boxes

# Add sample size on top
nbGroup <- nlevels(data$names)
text(
  x=c(1:nbGroup),
  y=boundaries$stats[nrow(boundaries$stats),] + 0.5,
  paste("n = ",table(data$names),sep="")
)