This post follows the previous
basic scatterplot
with ggplot2. It shows the kind of customization you
can apply to circles thanks to the
geom_point() options:
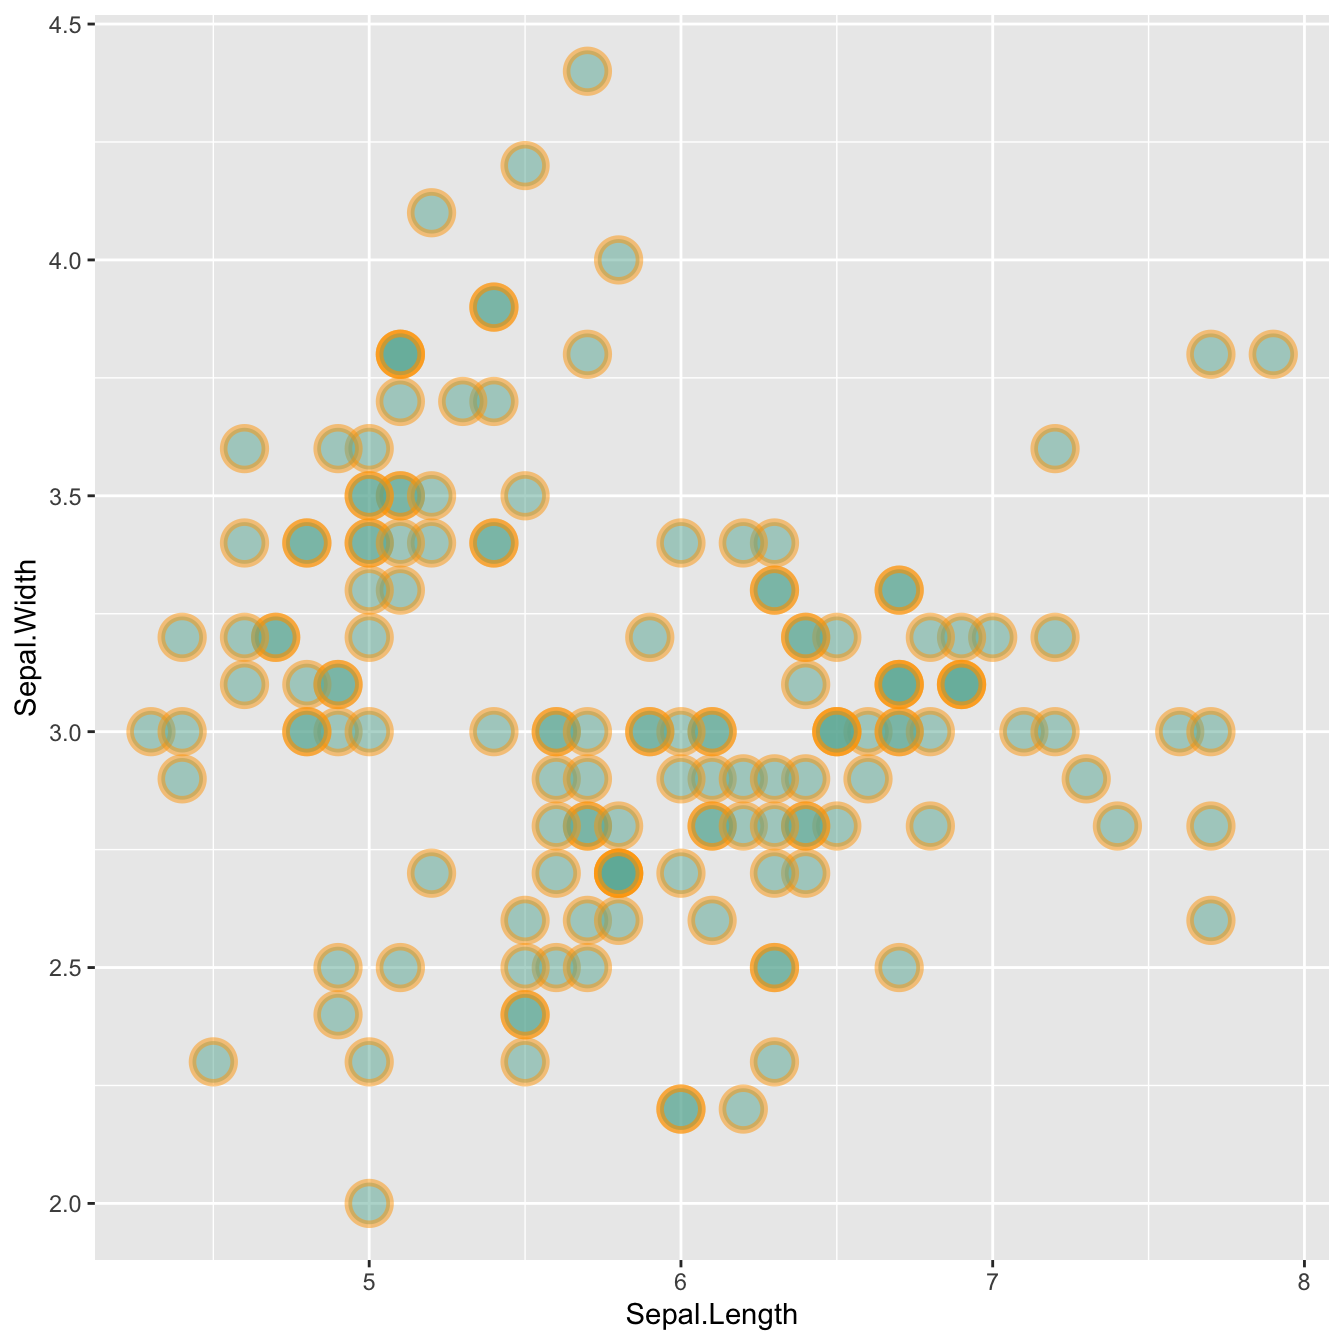
color: the stroke color, the circle outlinestroke: the stroke widthfill: color of the circle inner part-
shape: shape of the marker. See list in the ggplot2 section -
alpha: circle transparency, [0->1], 0 is fully transparent color: the stroke color, the circle outlinesize: circle size
Note: these options will be uniform among markers if you put
it in the geom_point() call. You can also map them to a
variable if put inside the aes() part of the code.
# library
library(ggplot2)

# Iris dataset is natively provided by R
#head(iris)

# use options!
ggplot(iris, aes(x=Sepal.Length, y=Sepal.Width)) +
    geom_point(
        color="orange",
        fill="#69b3a2",
        shape=21,
        alpha=0.5,
        size=6,
        stroke = 2
        )
Using theme_ipsum
Note that applying the theme_ipsum of the
hrbrthemes package is always a good option.