Hiding the first level for better styling
I personally do not like to display the big circle that surrounds the whole chart (level 0, origin). This circle does not provide any information, and the chart looks better without it in my opinion.
To get rid of it, just specify a color equal to the background color
in the scale_fill_manual() and
scale_color_manual() functions. Following the same idea,
you can get rid of as many levels of hierarchy as you like.
# Libraries
library(ggraph)
library(igraph)
library(tidyverse)
library(viridis)
# We need a data frame giving a hierarchical structure. Let's consider the flare dataset:
edges=flare$edges
vertices = flare$vertices
mygraph <- graph_from_data_frame( edges, vertices=vertices )
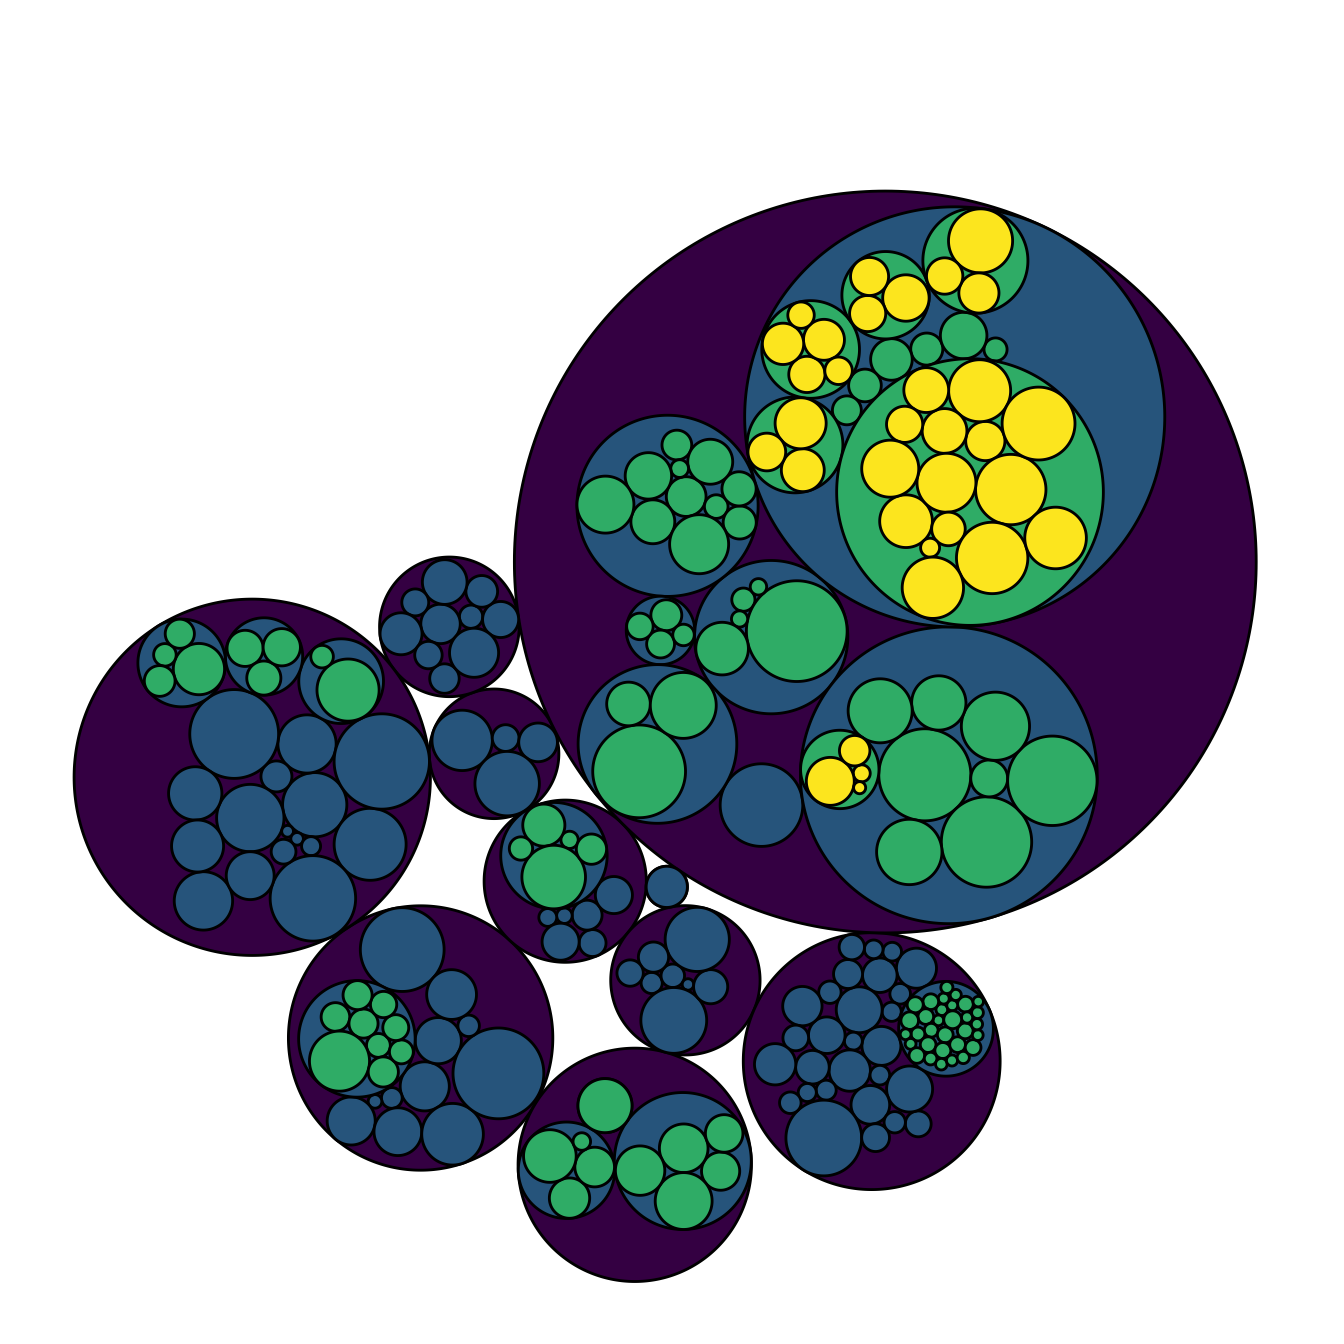
# Hide the first level (right)
ggraph(mygraph, layout = 'circlepack', weight=size) +
geom_node_circle(aes(fill = as.factor(depth), color = as.factor(depth) )) +
scale_fill_manual(values=c("0" = "white", "1" = viridis(4)[1], "2" = viridis(4)[2], "3" = viridis(4)[3], "4"=viridis(4)[4])) +
scale_color_manual( values=c("0" = "white", "1" = "black", "2" = "black", "3" = "black", "4"="black") ) +
theme_void() +
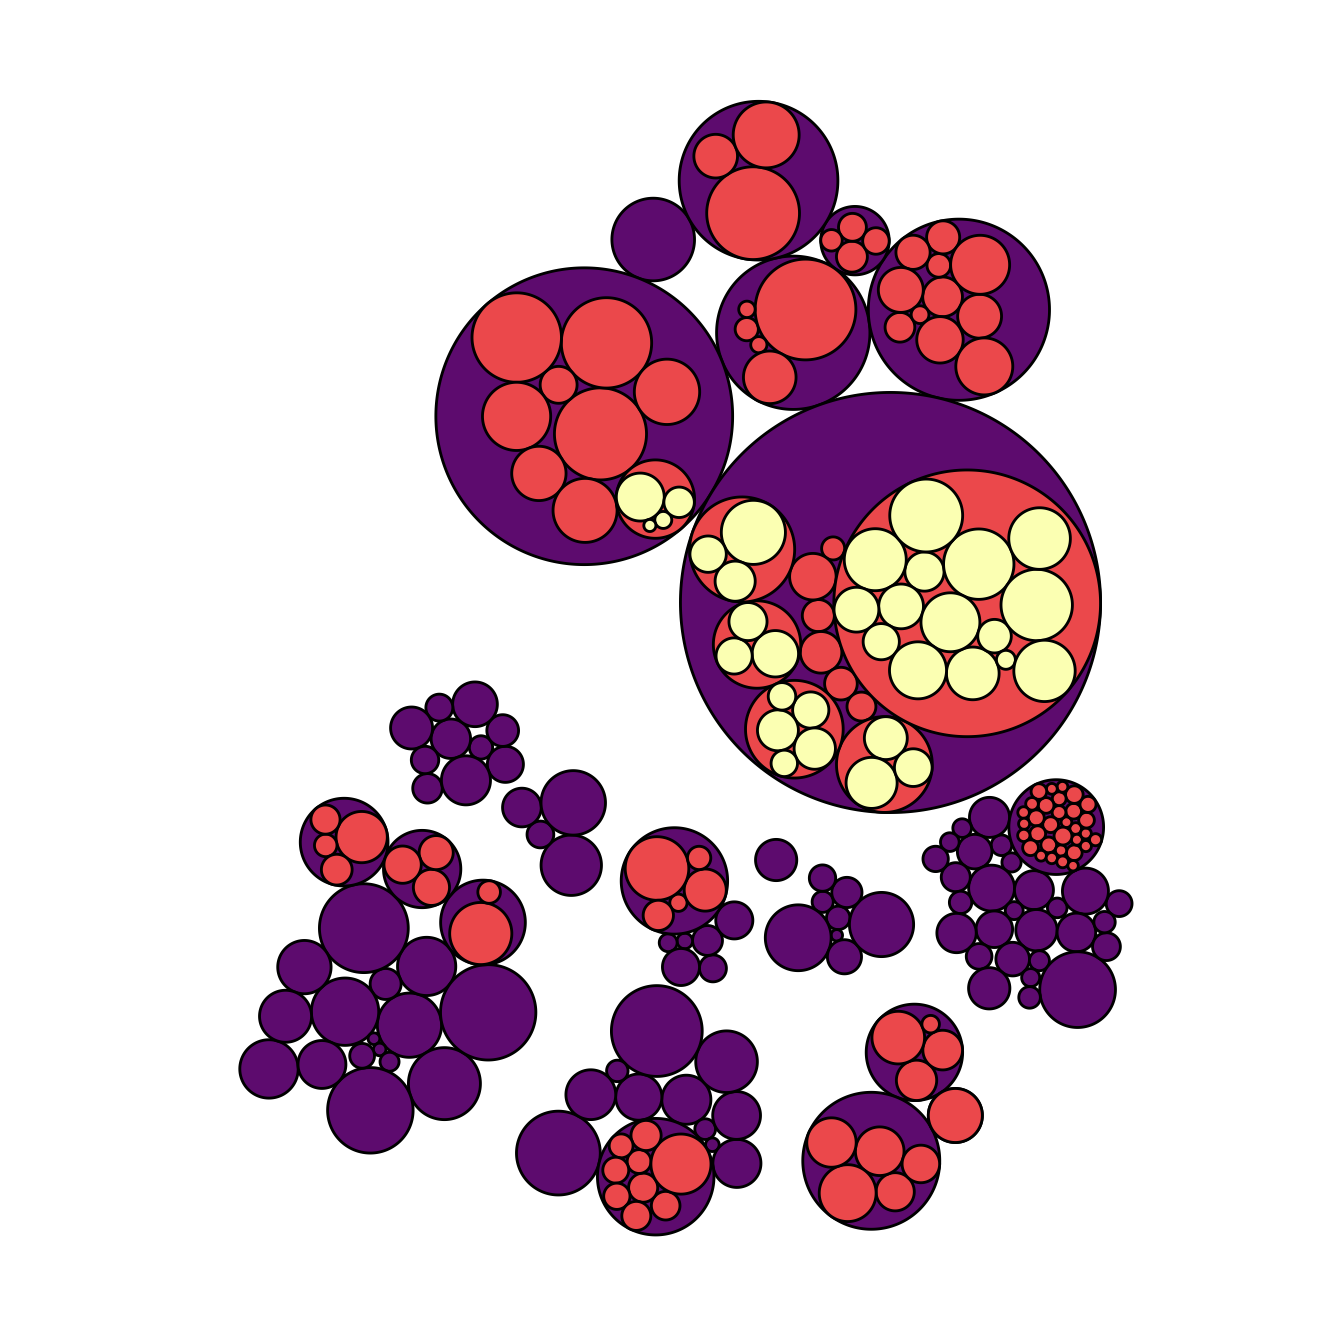
theme(legend.position="FALSE") # Second one: hide 2 first levels
ggraph(mygraph, layout = 'circlepack', weight=size) +
geom_node_circle(aes(fill = as.factor(depth), color = as.factor(depth) )) +
scale_fill_manual(values=c("0" = "white", "1" = "white", "2" = magma(4)[2], "3" = magma(4)[3], "4"=magma(4)[4])) +
scale_color_manual( values=c("0" = "white", "1" = "white", "2" = "black", "3" = "black", "4"="black") ) +
theme_void() +
theme(legend.position="FALSE")Add labels to a specific level of the hierarchy
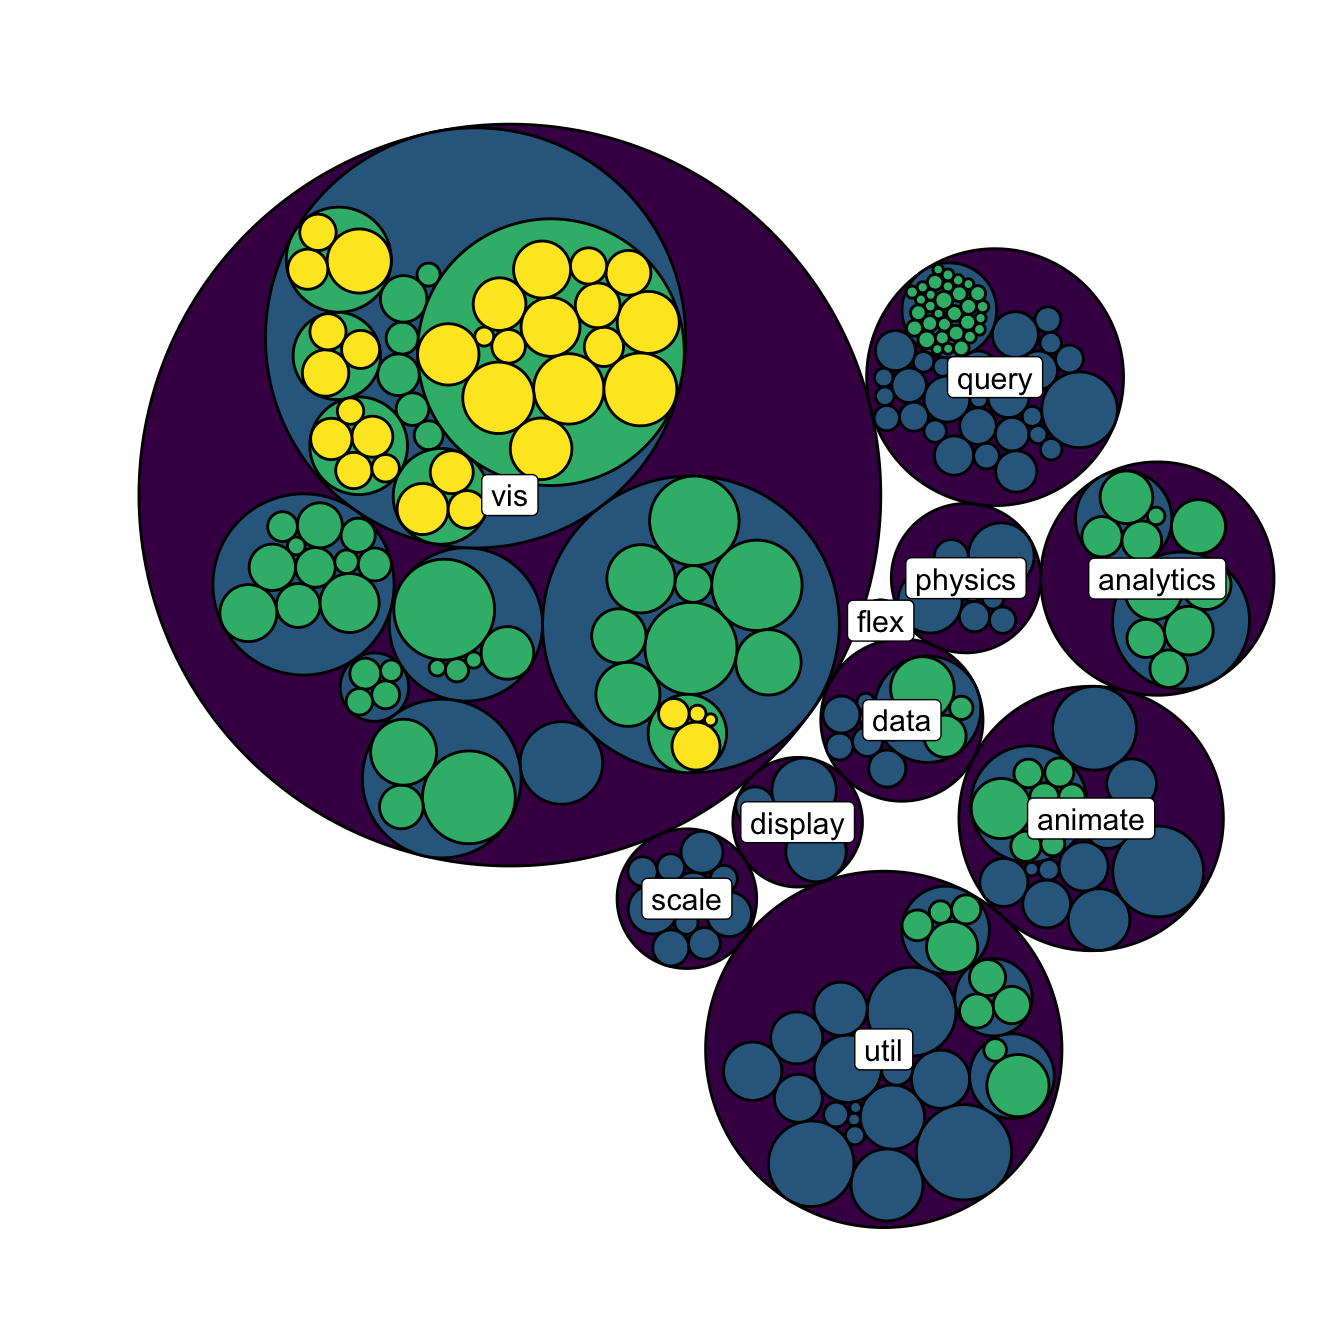
A related problem consists to add labels for one specific level of hierarchy only. For instance, if you want to display the names of group of level2, but not of level 3 to avoid cluttering the chart.
To solve this issue, the trickiest part is to determine the level
of each node in the edge list data frame. Fortunately, the
data.tree library is here to help with its
FromDataFrameNetwork() function. It allows to isolate
the level of each node, making it a breeze to select the labels to
display.
# Add the data.tree library
library(data.tree)

# Rebuild the data
edges <-flare$edges
vertices <- flare$vertices

# Transform it in a 'tree' format
tree <- FromDataFrameNetwork(edges)

# Then I can easily get the level of each node, and add it to the initial data frame:
mylevels <- data.frame( name=tree$Get('name'), level=tree$Get("level") )
vertices <- vertices %>%
  left_join(., mylevels, by=c("name"="name"))

# Now we can add label for level1 and 2 only for example:
vertices <- vertices %>%
  mutate(new_label=ifelse(level==2, shortName, NA))
mygraph <- graph_from_data_frame( edges, vertices=vertices )

# Make the graph
ggraph(mygraph, layout = 'circlepack', weight=size) +
  geom_node_circle(aes(fill = as.factor(depth), color = as.factor(depth) )) +
  scale_fill_manual(values=c("0" = "white", "1" = viridis(4)[1], "2" = viridis(4)[2], "3" = viridis(4)[3], "4"=viridis(4)[4])) +
  scale_color_manual( values=c("0" = "white", "1" = "black", "2" = "black", "3" = "black", "4"="black") ) +
  geom_node_label( aes(label=new_label), size=4) +
  theme_void() +
  theme(legend.position="FALSE", plot.margin = unit(rep(0,4), "cm"))