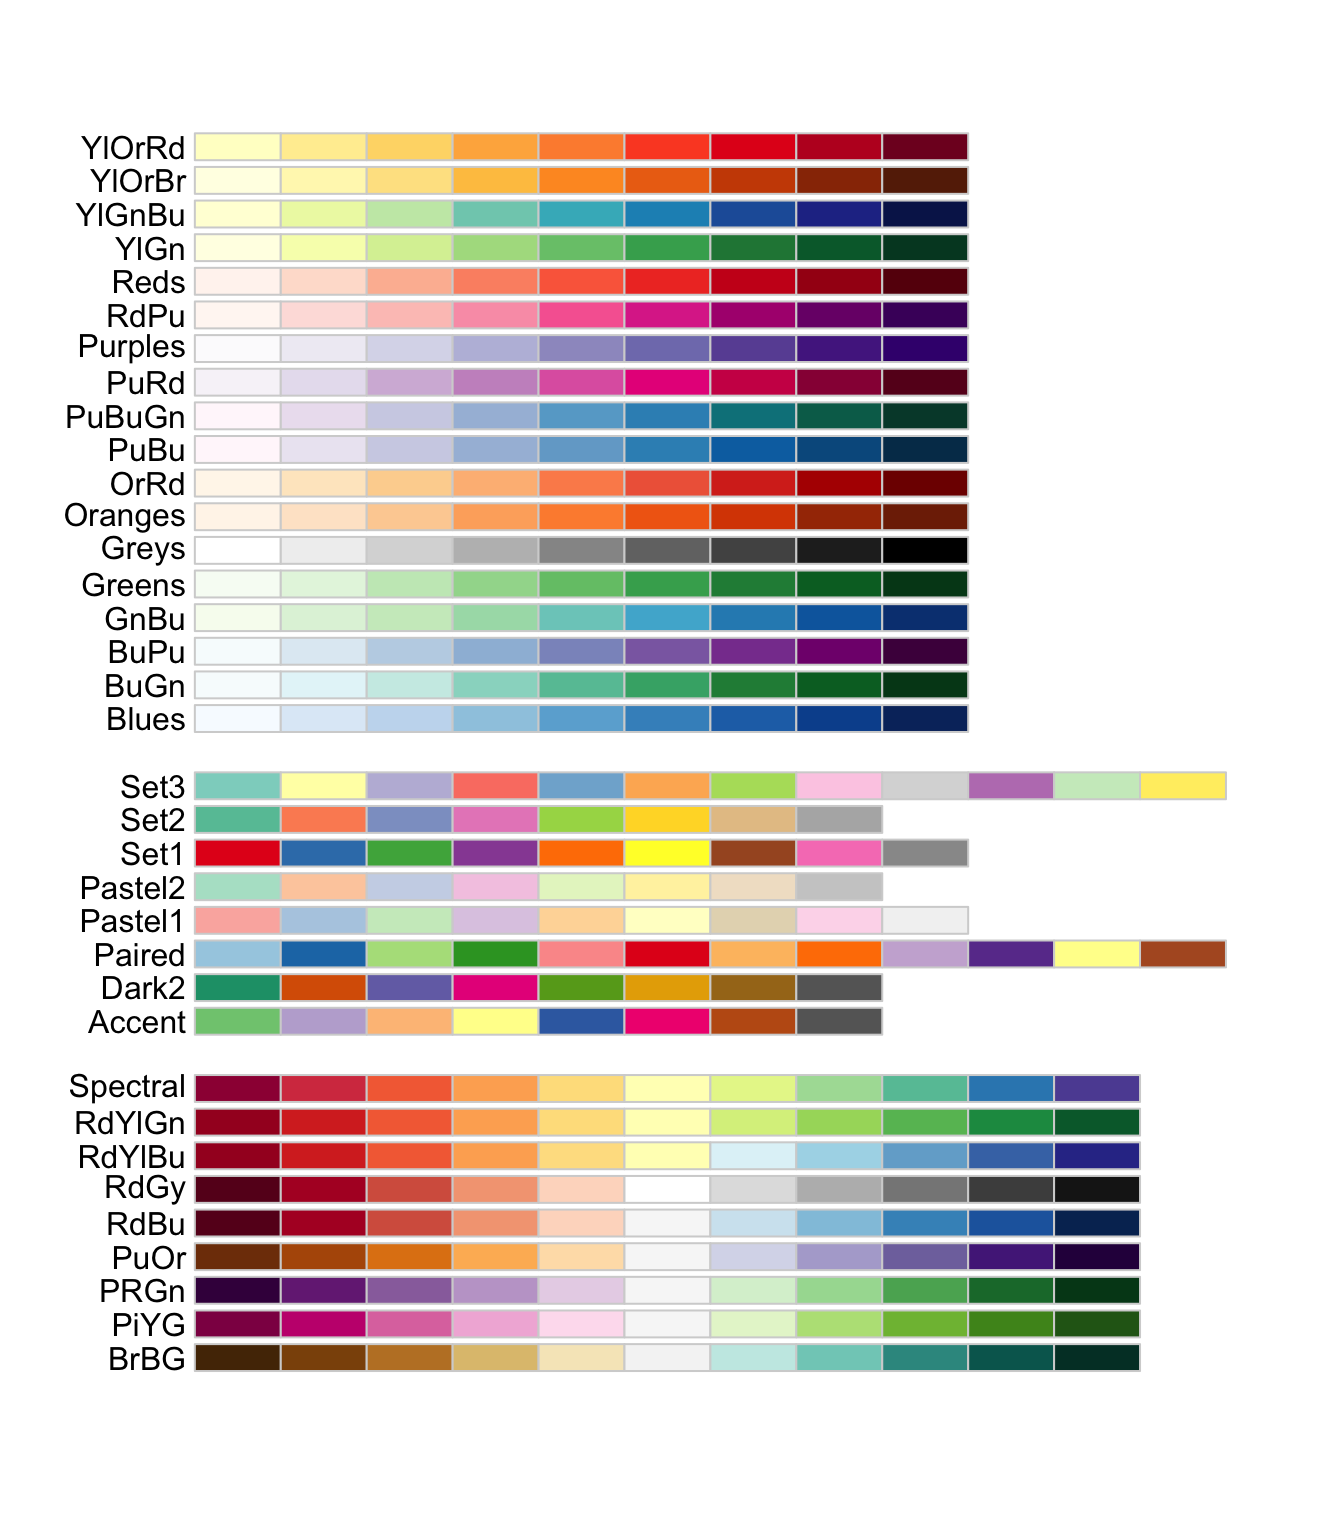
The RColorBrewer package is an unavoidable tool to
manage colors with R. It offers several color palettes, as you can
see in the attached figure. This page just allows to visualize the
composition of each palette.
Other pages explain how to use this
tool.
There are 3 types of palettes :
-
Sequential palettes are suited to ordered data that progress from low to high. Lightness steps dominate the look of these schemes, with light colors for low data values to dark colors for high data values.
-
Diverging palettes put equal emphasis on mid-range critical values and extremes at both ends of the data range. The critical class or break in the middle of the legend is emphasized with light colors and low and high extremes are emphasized with dark colors that have contrasting hues.
-
Qualitative palettes do not imply magnitude differences between legend classes, and hues are used to create the primary visual differences between classes. Qualitative schemes are best suited to representing nominal or categorical data.