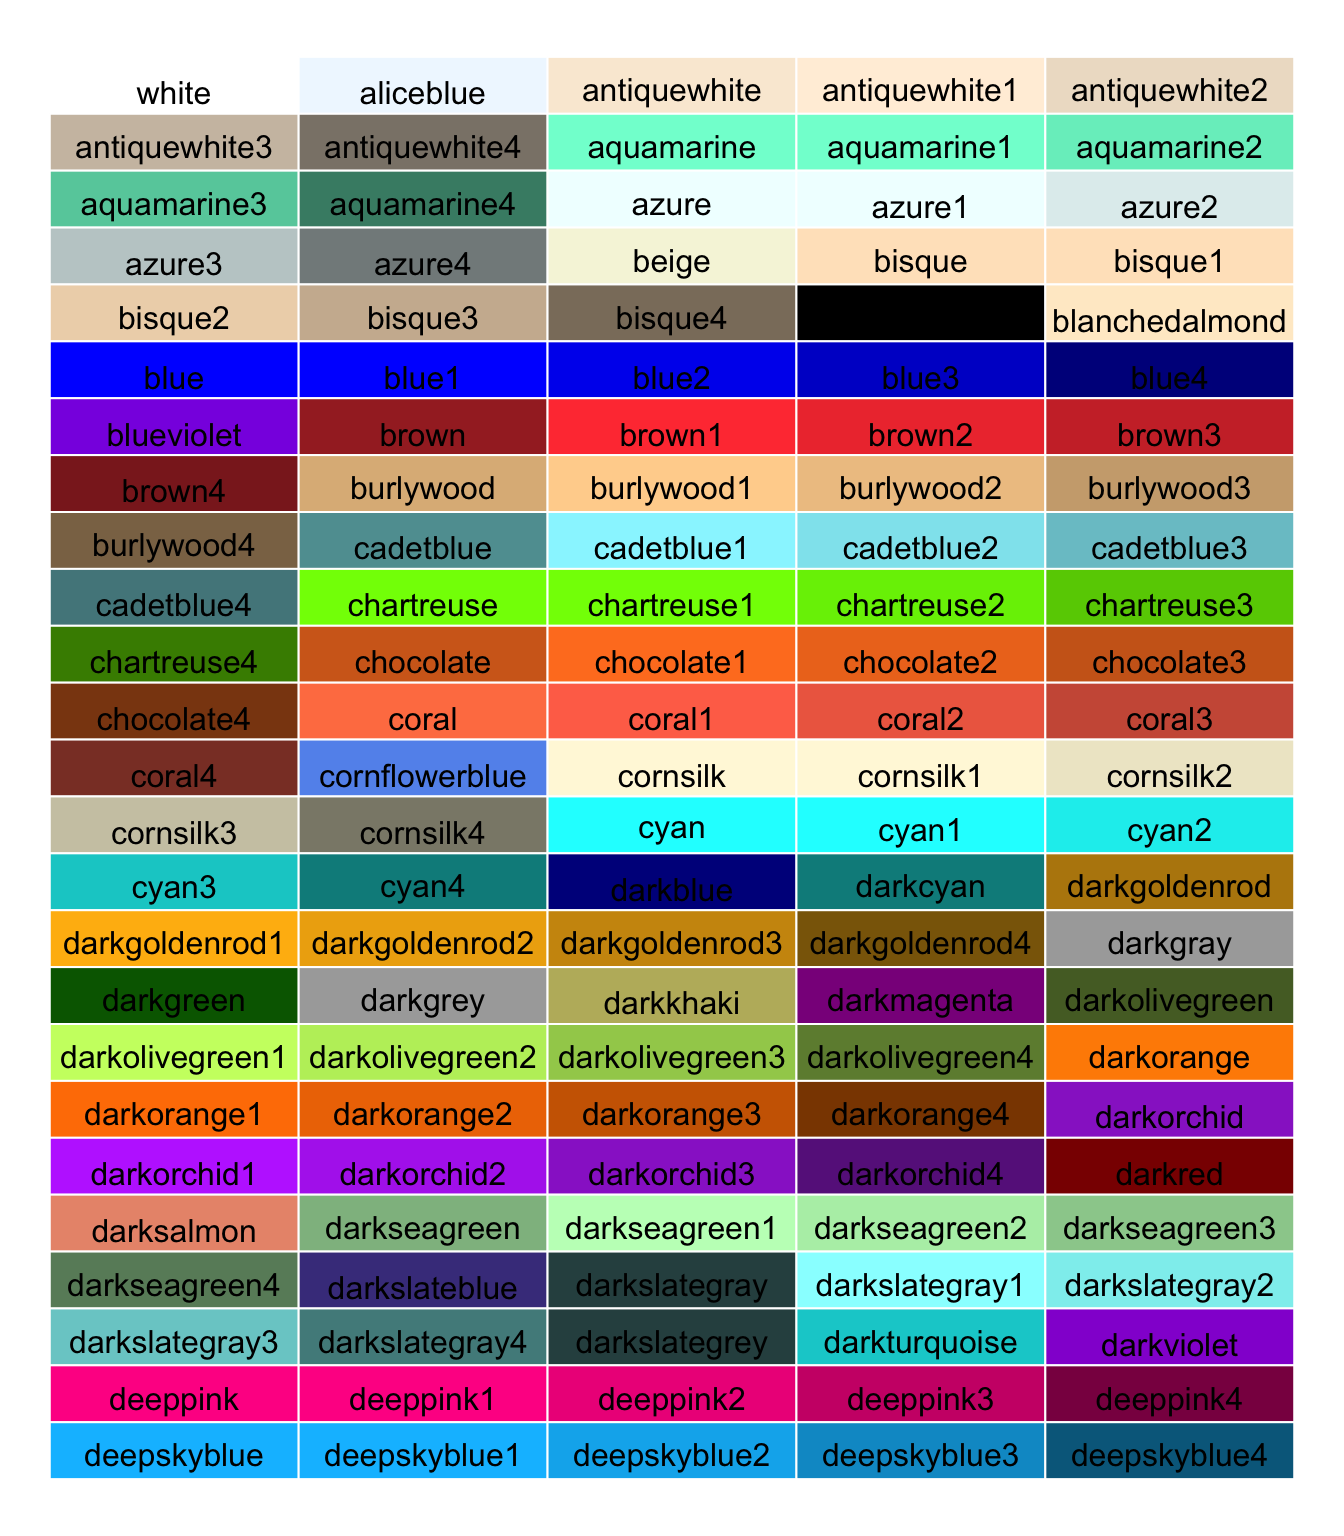
It is possible to call a color by its name in R. Here
is an overview of the main colors offered.
Note that you can see a complete list of the 657 colors typing
colors().
See the color section of the gallery for more color calling options.
# No margin around chart
par(mar=c(0,0,0,0))

# Empty chart
plot(0, 0, type = "n", xlim = c(0, 1), ylim = c(0, 1), axes = FALSE, xlab = "", ylab = "")

# Settings
line <- 25
col <- 5

# Add color background
rect(
  rep((0:(col - 1)/col),line) ,
  sort(rep((0:(line - 1)/line),col),decreasing=T),
  rep((1:col/col),line) ,
  sort(rep((1:line/line),col),decreasing=T),
  border = "white" ,
  col=colors()[seq(1,line*col)])

# Color names
text(
  rep((0:(col - 1)/col),line)+0.1 ,
  sort(rep((0:(line - 1)/line),col),decreasing=T)+0.015 ,
  colors()[seq(1,line*col)]  ,
  cex=1)