The rgb() function describes a color giving the
intensity of the 3 primary colors: red, green and blue.
To use the function: rgb(red, green, blue, alpha) :
quantity of red (between 0 and 1), of green and of blue, and finally
transparency (alpha).
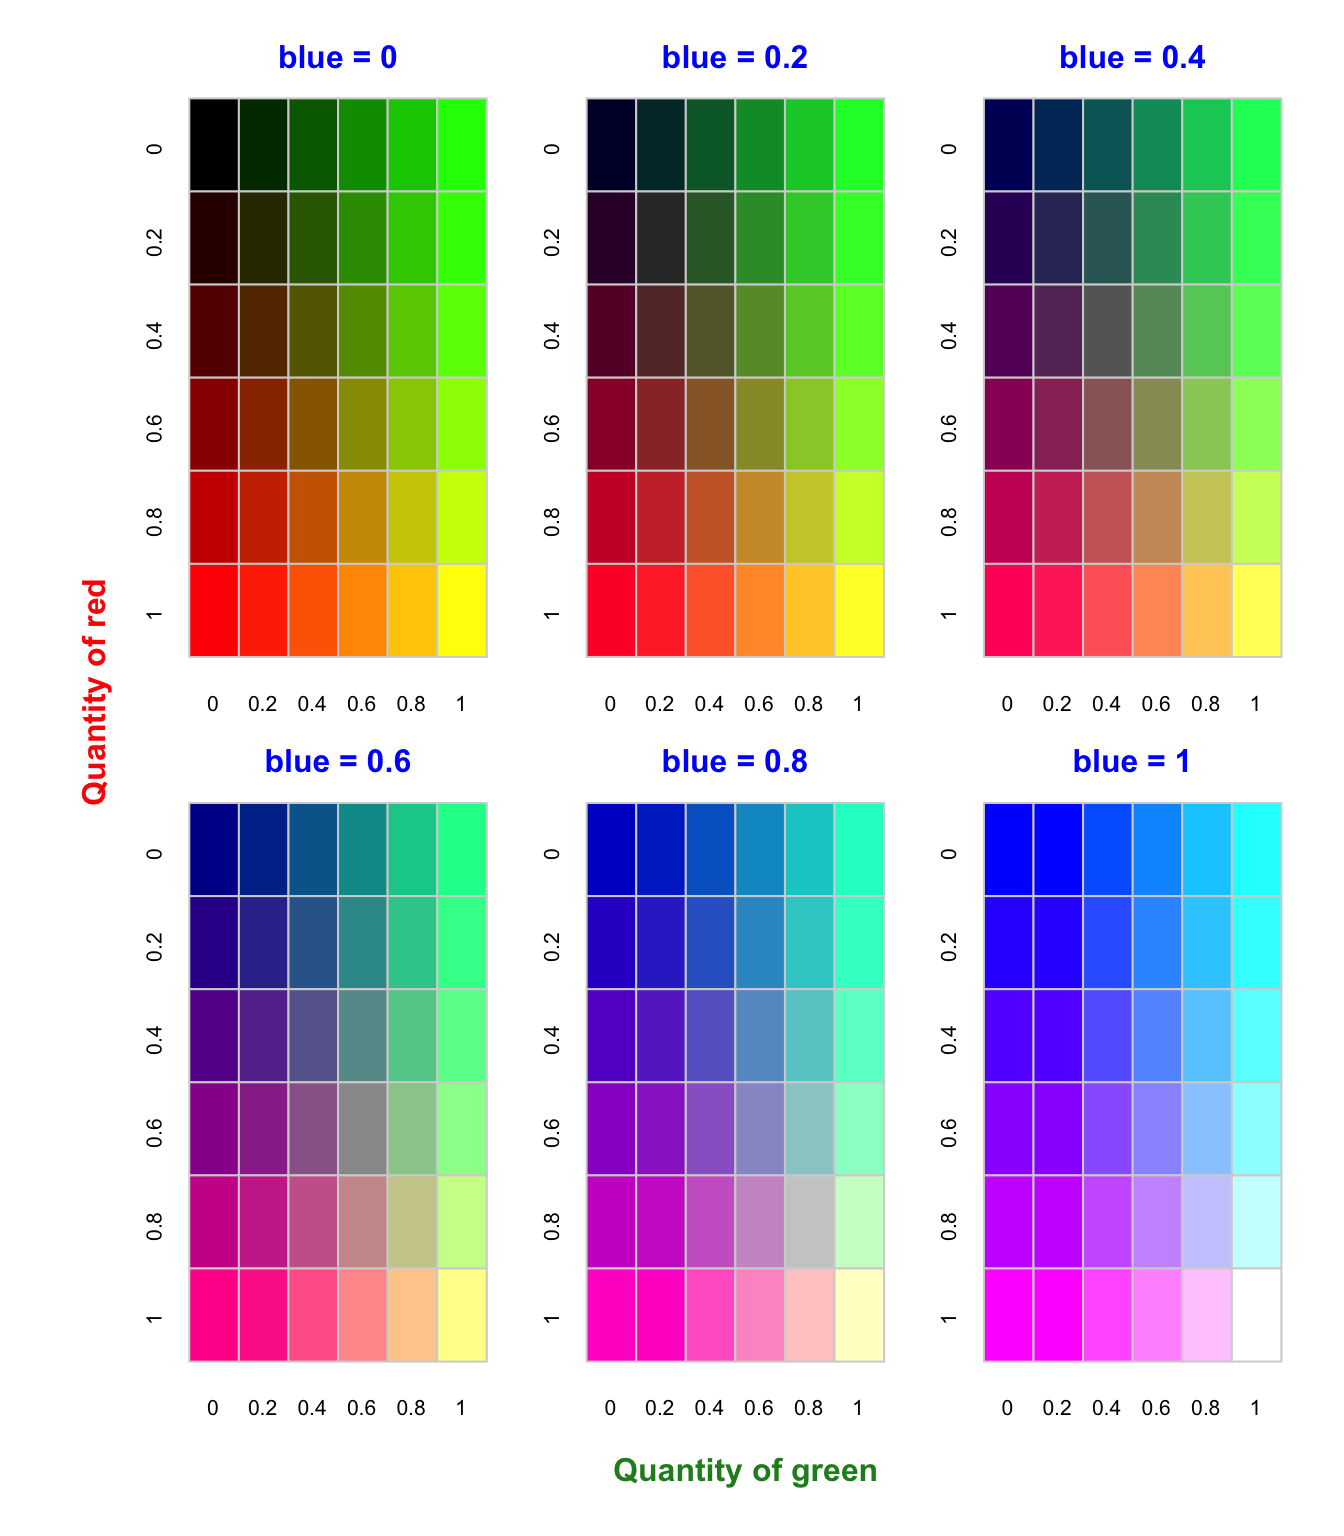
This picture shows the colors you get for a given red value (Y axis), green value (X axis) and blue value. The transparency is set to 1.
par(mfrow=c(2,3) , mar=c(2,2,2,1) , oma=c(4,5,1,1) )

line <- 6
col <- 6
red <- sort(rep(c(0,0.2,0.4,0.6,0.8,1),col))
green <- rep(c(0,0.2,0.4,0.6,0.8,1),line)
num <- 0

for(i in seq(0,1,0.2)){
    num <- num+1
    plot(0, 0, type = "n", xlim = c(0, 1), ylim = c(0, 1), axes = FALSE, xlab = "", ylab = "" )
    colors <- rgb(red,green,i,1)
    mtext(paste("blue = ",i,sep="") , side=3 , line=0.15 , col="blue" , font=2)
    rect(  rep((0:(col - 1)/col),line) ,  sort(rep((0:(line - 1)/line),col),decreasing=T)   ,   rep((1:col/col),line) , sort(rep((1:line/line),col),decreasing=T),  border = "light gray" , col=colors)
    axis(2 , at=c(17,14,11,8,5,2)/18-0.035 , labels=c("0","0.2","0.4","0.6","0.8","1") , tick=F , lty=6 , pos=0.01)
    axis(3 , at=c(1.5 , 3.5 , 5.5 , 7.5 , 9.5 , 11.5)/12-0.045 , labels=c("0","0.2","0.4","0.6","0.8","1") , tick=F , pos=-0.15)
    }

mtext("Quantity of red", side=2 , line=34 , col="red" , font=2 , at=1.2)
mtext("Quantity of green", side=1 , line=3 , at=-0.8 , col="forestgreen" , font=2)