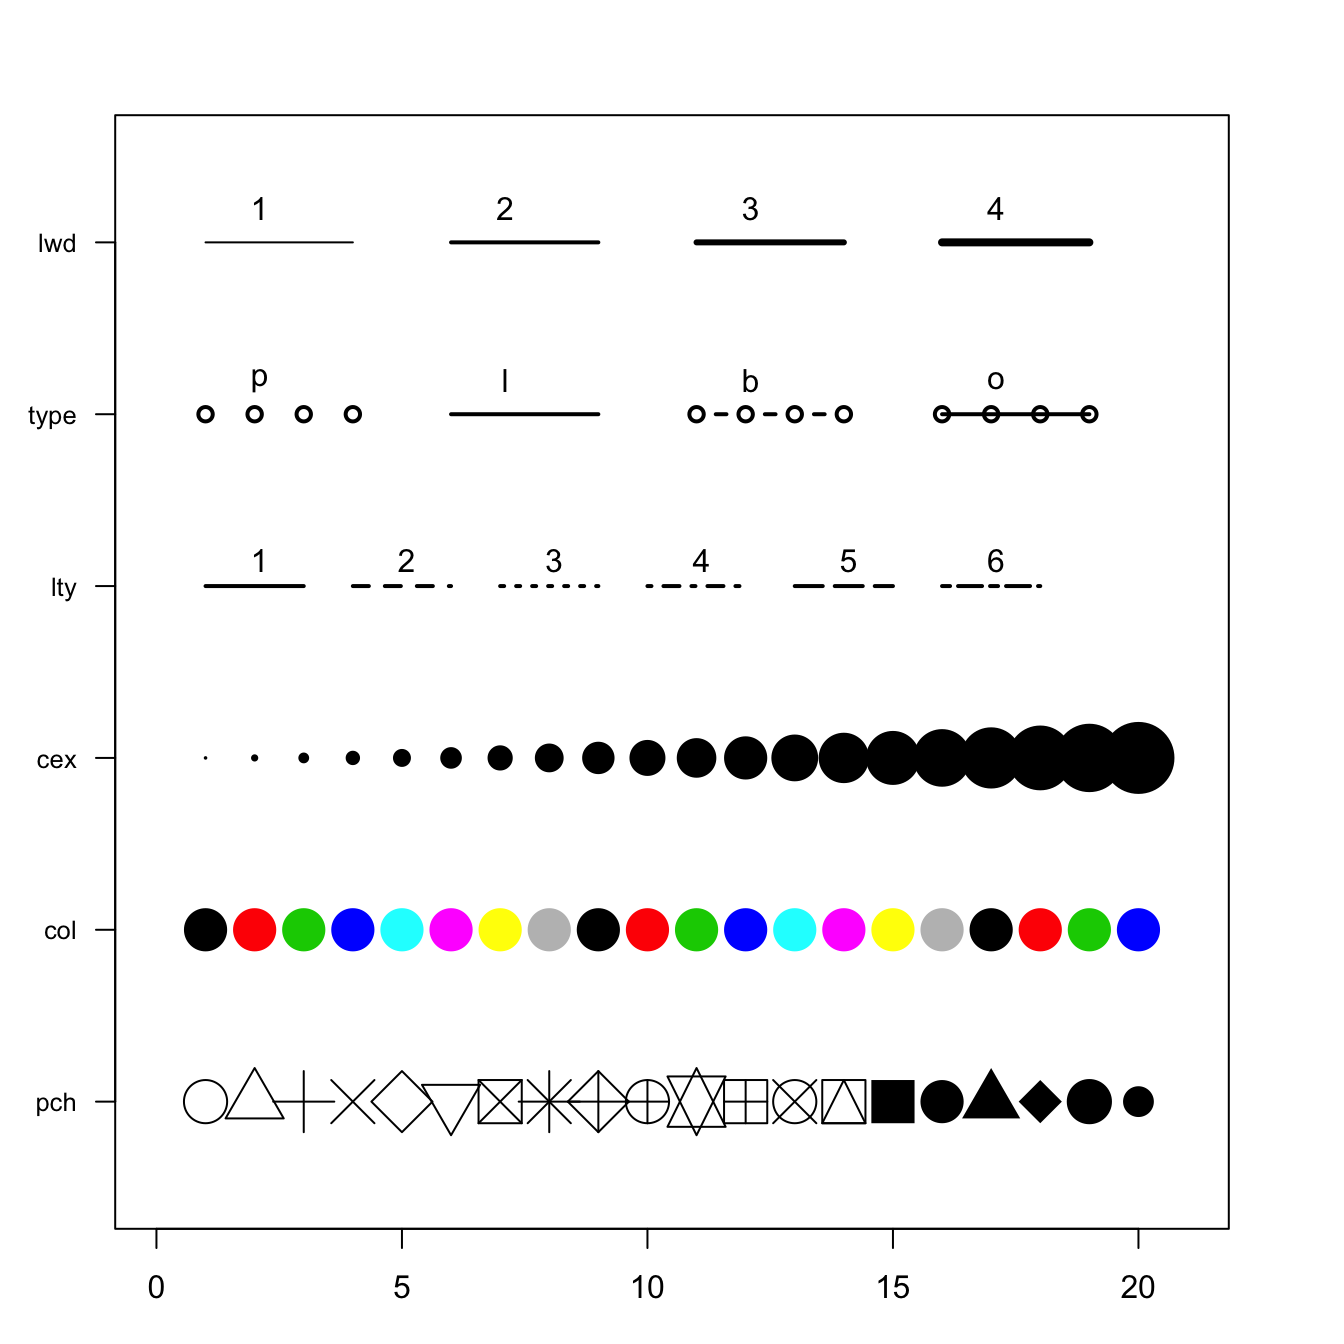
Base R offers many option to customize the chart appearance. Basically everthing is doable with those few options:
lwd→ line widthtype→ link between dotslty→ line typecex→ shape sizecol→ control colorspch→ marker shape
# initialization
par(mar=c(3,3,3,3))
num <- 0 ;
num1 <- 0
plot(0,0 , xlim=c(0,21) , ylim=c(0.5,6.5), col="white" , yaxt="n" , ylab="" , xlab="")

#fill the graph
for (i in seq(1,20)){
  points(i,1 , pch=i , cex=3)
  points(i,2 , col=i , pch=16 , cex=3)
  points(i,3 , col="black" , pch=16 , cex=i*0.25)

  #lty
  if(i %in% c(seq(1,18,3))){
        num=num+1
    points(c(i,i+2), c(4,4) , col="black" , lty=num , type="l" , lwd=2)
        text(i+1.1 , 4.15 , num)
        }

  #type and lwd
  if(i %in% c(seq(1,20,5))){
    num1=num1+1
    points(c(i,i+1,i+2,i+3), c(5,5,5,5) , col="black"  , type=c("p","l","b","o")[num1] , lwd=2)
    text(i+1.1 , 5.2 , c("p","l","b","o")[num1] )
    points(c(i,i+1,i+2,i+3), c(6,6,6,6) , col="black"  , type="l",  lwd=num1)
    text(i+1.1 , 6.2 , num1 )

    }
  }

#add axis
axis(2, at = c(1,2,3,4,5,6), labels = c("pch" , "col" , "cex" , "lty", "type" , "lwd" ),
     tick = TRUE, col = "black", las = 1, cex.axis = 0.8)