There are 2 margin areas in base R plots:
margin and oma. You can control their size
calling the par() function before your plot and giving
the corresponding arguments:
mar()for margin.oma()for outer margin area.
For both arguments, you must give four values giving the desired
space in the bottom, left, top and right part of the chart
respectively. For instance, par(mar=c(4,0,0,0)) draws a
margin of size 4 only on the bottom of the chart.
You can use mai() and omi() if you want to
set the areas in inches and not in lines.
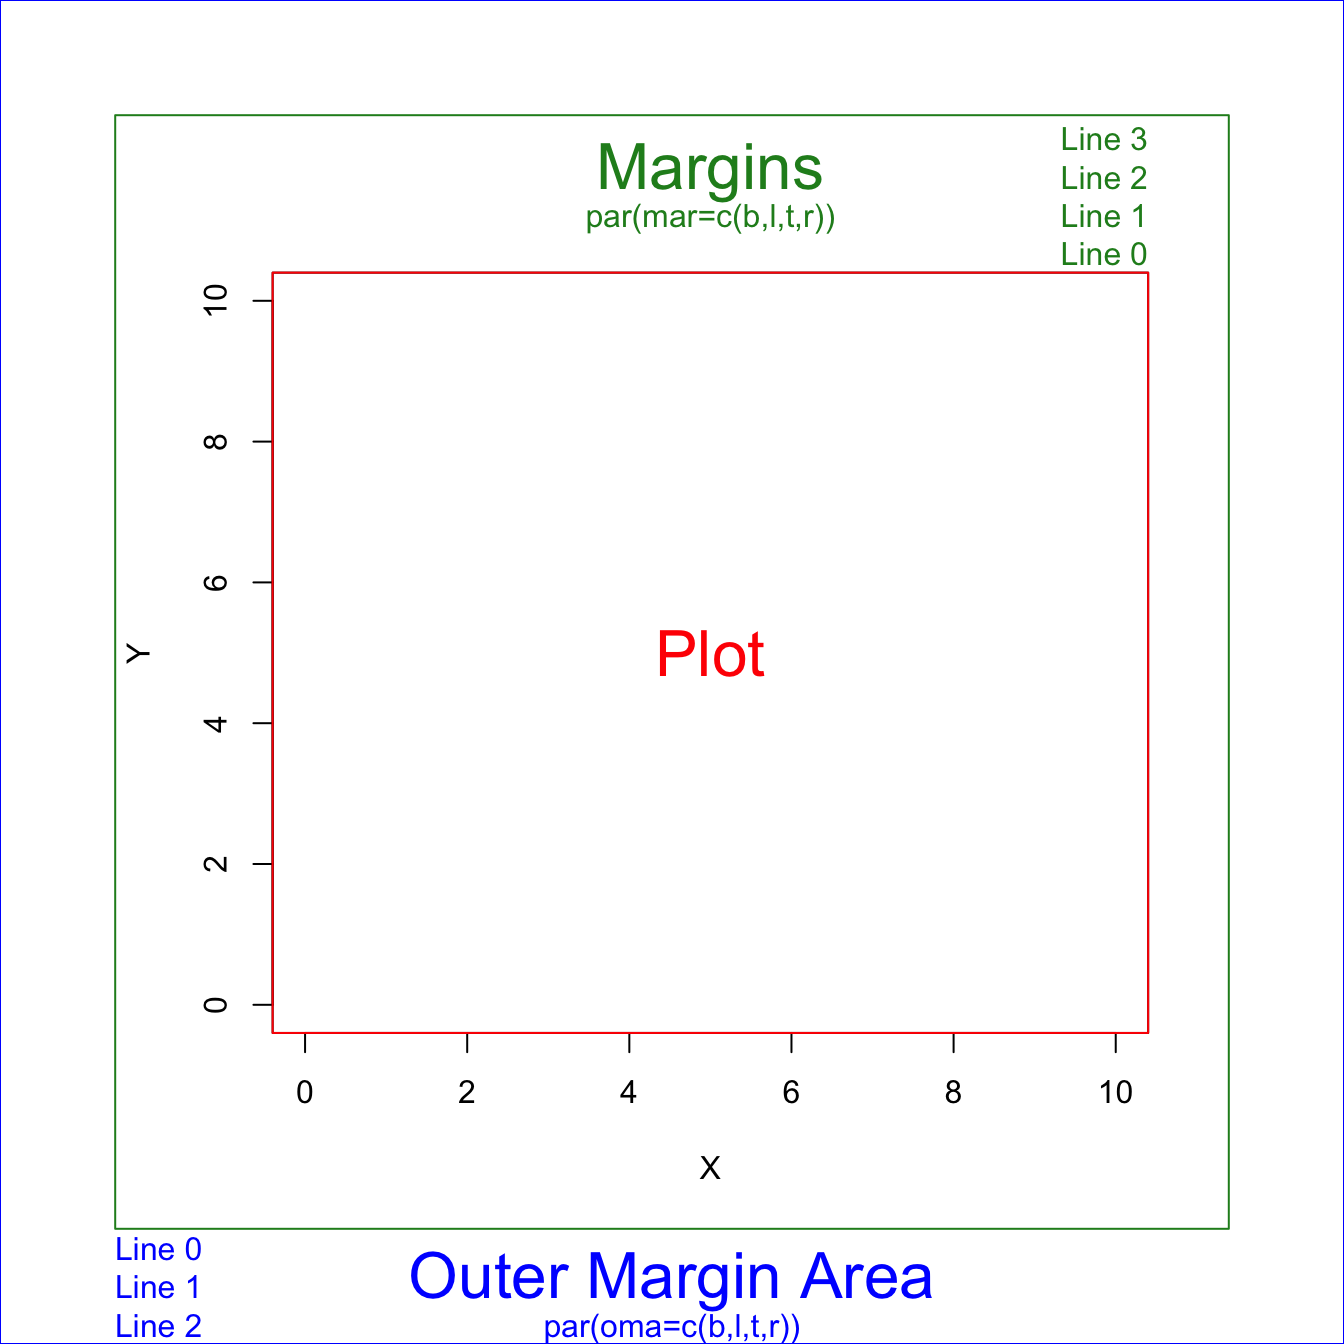
# Margins area
par(oma=c(3,3,3,3)) # all sides have 3 lines of space
par(mar=c(5,4,4,2) + 0.1)

# Plot
plot(0:10, 0:10, type="n", xlab="X", ylab="Y") # type="n" hides the points

# Place text in the plot and color everything plot-related red
text(5,5, "Plot", col="red", cex=2)
box(col="red")

# Place text in the margins and label the margins, all in forestgreen
mtext("Margins", side=3, line=2, cex=2, col="forestgreen")
mtext("par(mar=c(b,l,t,r))", side=3, line=1, cex=1, col="forestgreen")
mtext("Line 0", side=3, line=0, adj=1.0, cex=1, col="forestgreen")
mtext("Line 1", side=3, line=1, adj=1.0, cex=1, col="forestgreen")
mtext("Line 2", side=3, line=2, adj=1.0, cex=1, col="forestgreen")
mtext("Line 3", side=3, line=3, adj=1.0, cex=1, col="forestgreen")
box("figure", col="forestgreen")

# Label the outer margin area and color it blue
# Note the 'outer=TRUE' command moves us from the figure margins to the outer margins.
mtext("Outer Margin Area", side=1, line=1, cex=2, col="blue", outer=TRUE)
mtext("par(oma=c(b,l,t,r))", side=1, line=2, cex=1, col="blue", outer=TRUE)
mtext("Line 0", side=1, line=0, adj=0.0, cex=1, col="blue", outer=TRUE)
mtext("Line 1", side=1, line=1, adj=0.0, cex=1, col="blue", outer=TRUE)
mtext("Line 2", side=1, line=2, adj=0.0, cex=1, col="blue", outer=TRUE)
box("outer", col="blue")