This example illustrates how to split the plotting window in base R
thanks to the layout function. Contrary to the
par(mfrow=...) solution, layout() allows
greater control of panel parts.
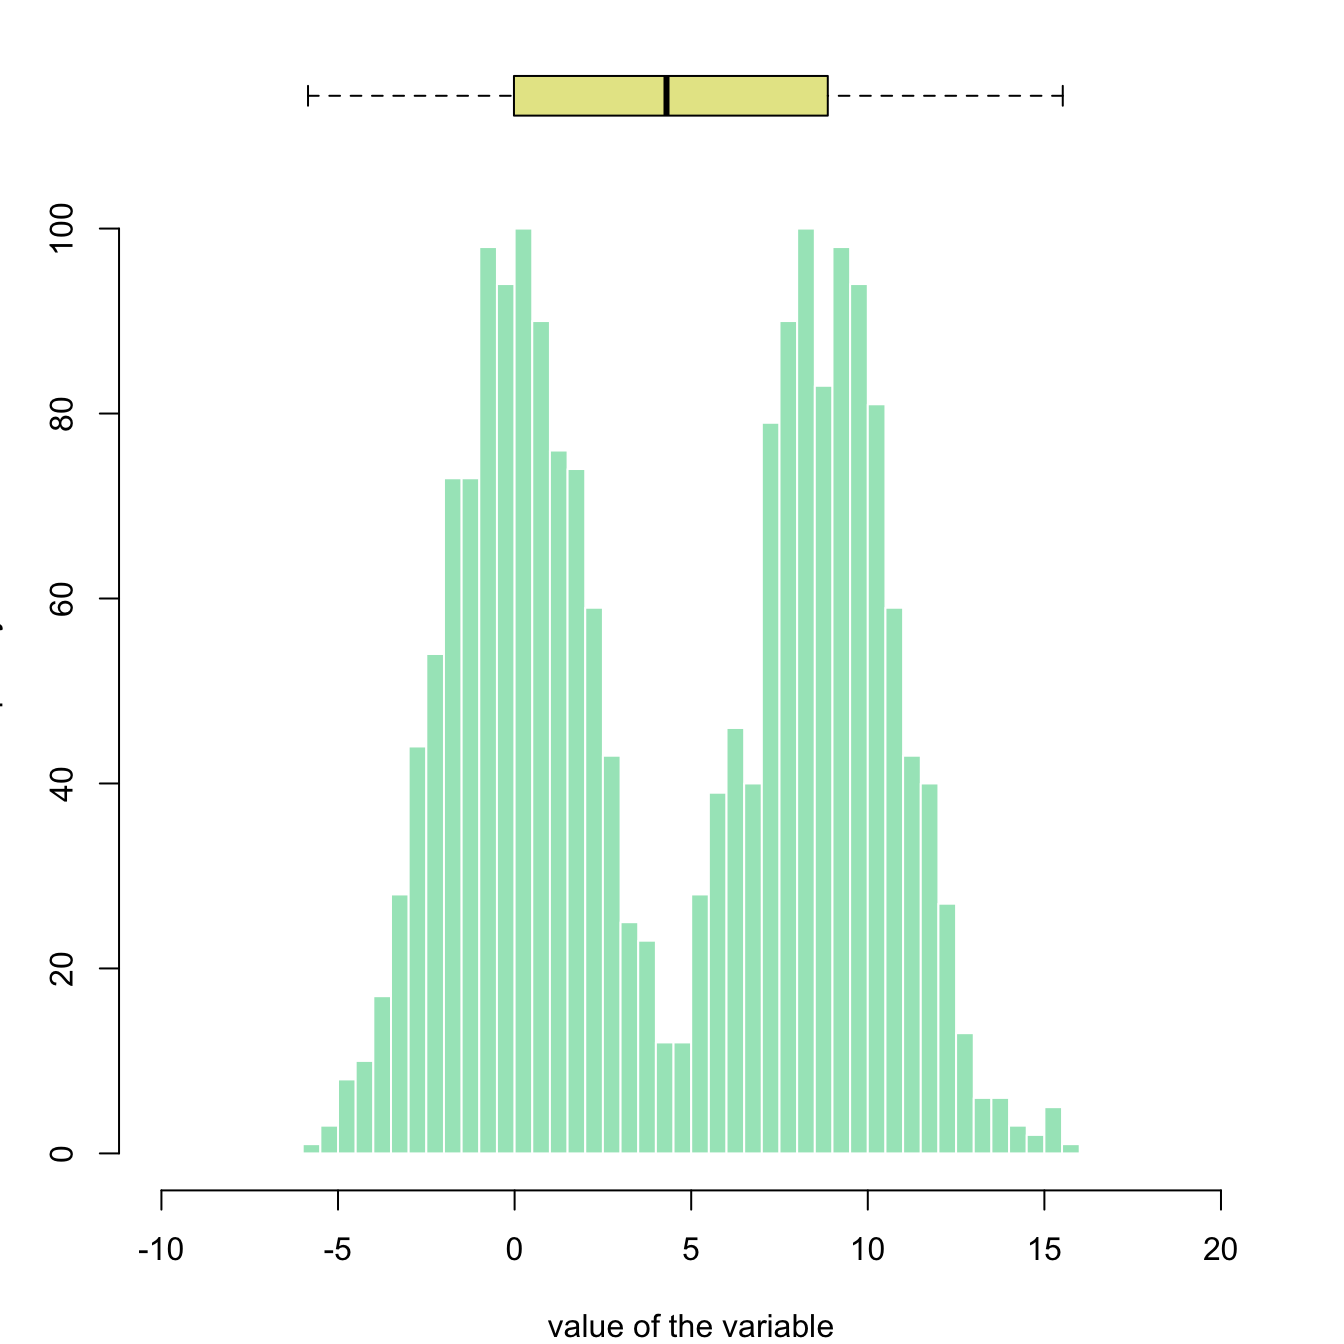
Here a boxplot is added on top of the histogram, allowing to quickly observe summary statistics of the distribution.
# Create data
my_variable=c(rnorm(1000 , 0 , 2) , rnorm(1000 , 9 , 2))

# Layout to split the screen
layout(mat = matrix(c(1,2),2,1, byrow=TRUE),  height = c(1,8))

# Draw the boxplot and the histogram
par(mar=c(0, 3.1, 1.1, 2.1))
boxplot(my_variable , horizontal=TRUE , ylim=c(-10,20), xaxt="n" , col=rgb(0.8,0.8,0,0.5) , frame=F)
par(mar=c(4, 3.1, 1.1, 2.1))
hist(my_variable , breaks=40 , col=rgb(0.2,0.8,0.5,0.5) , border=F , main="" , xlab="value of the variable", xlim=c(-10,20))