Animation


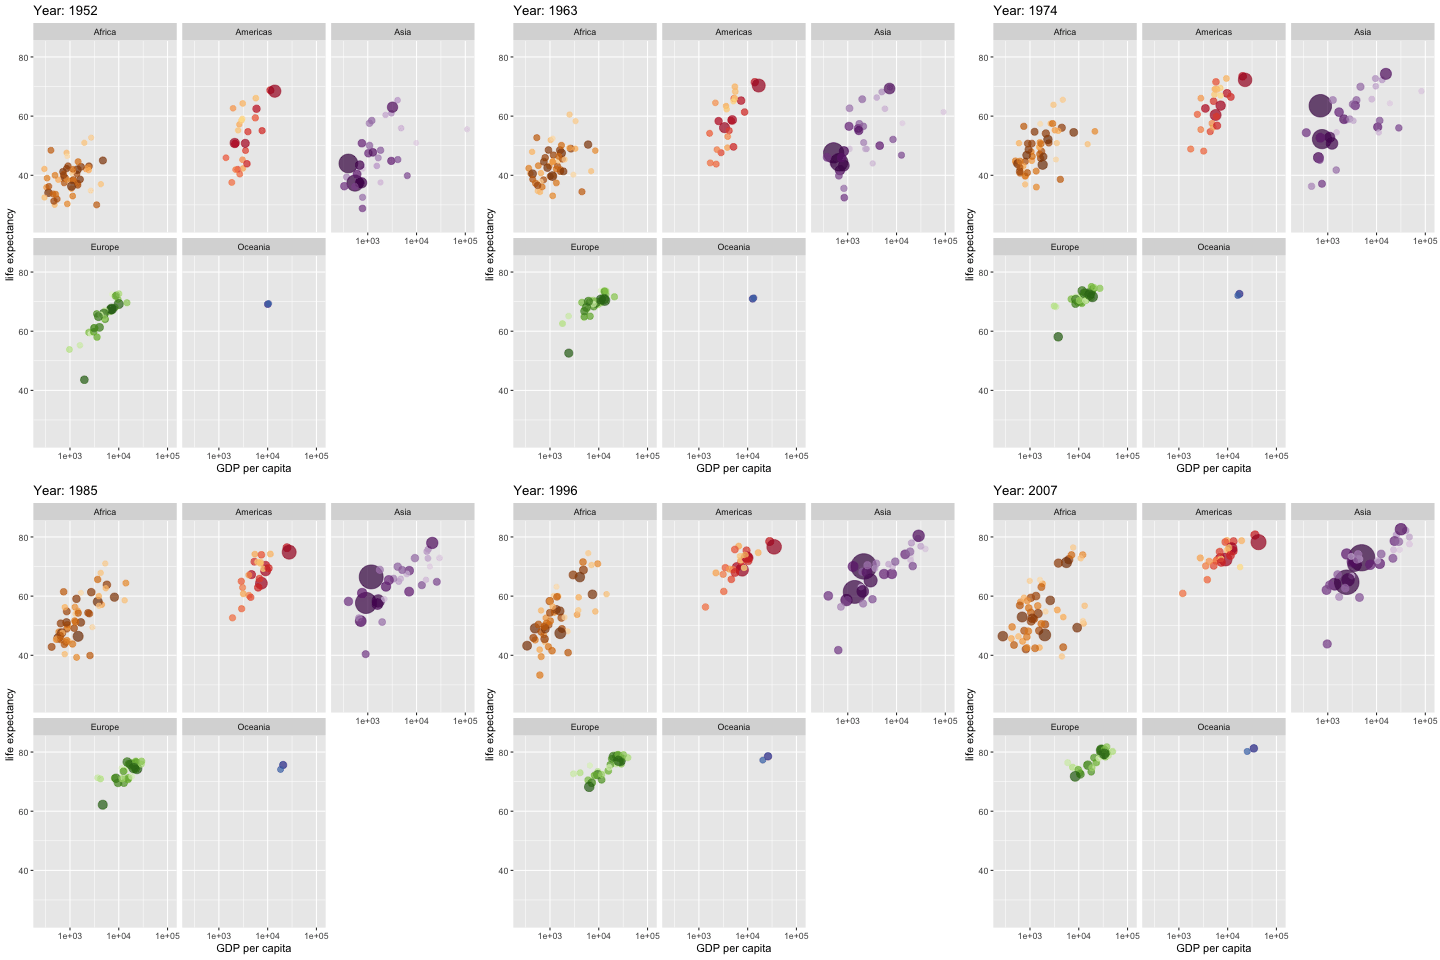
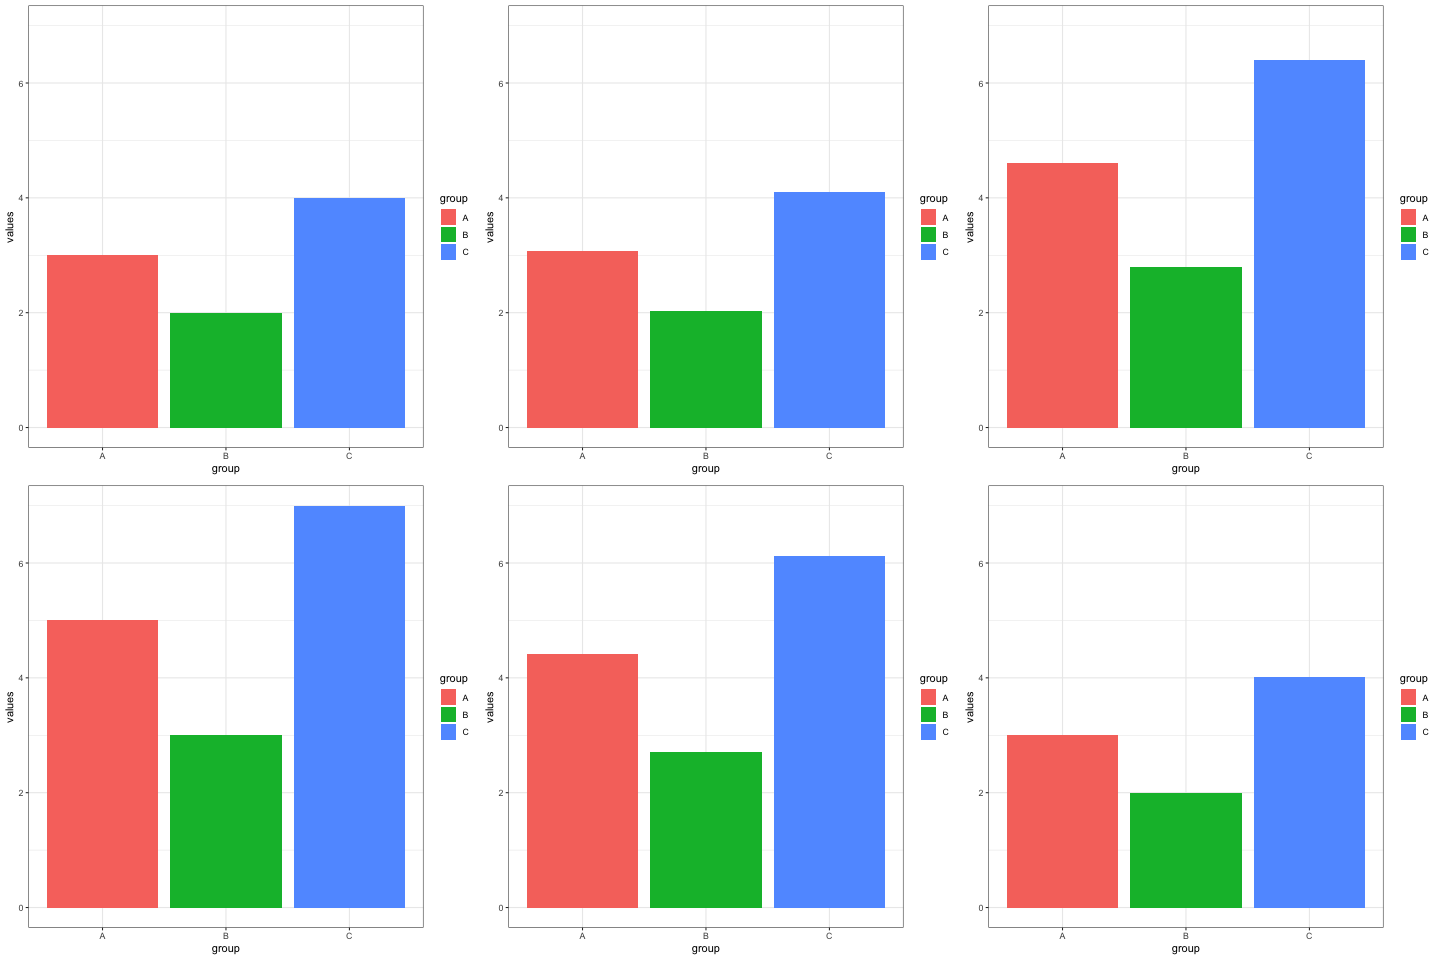
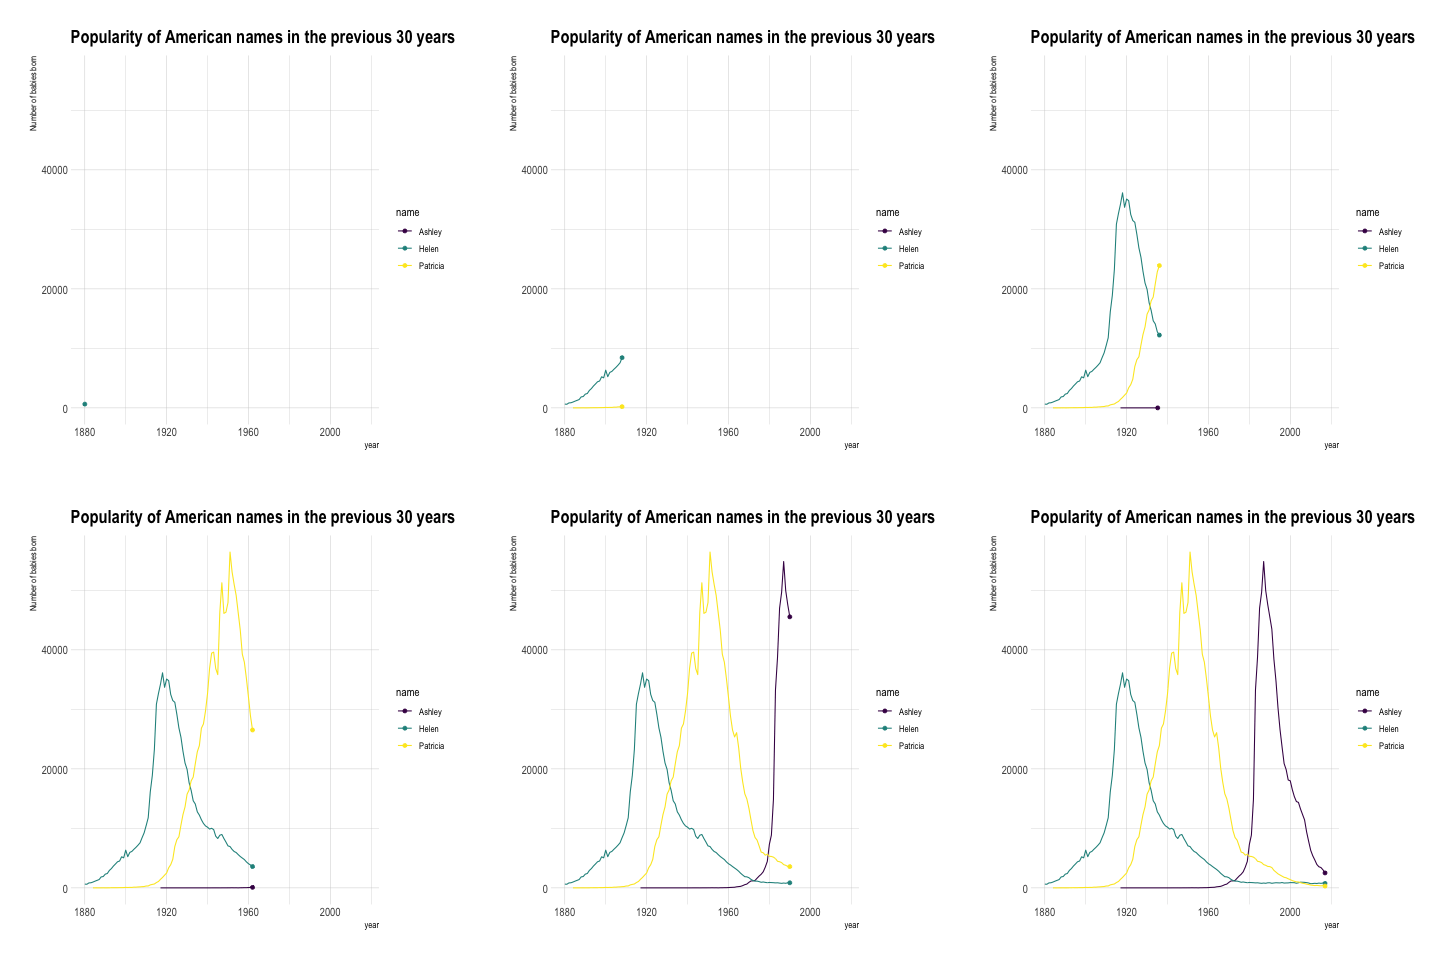
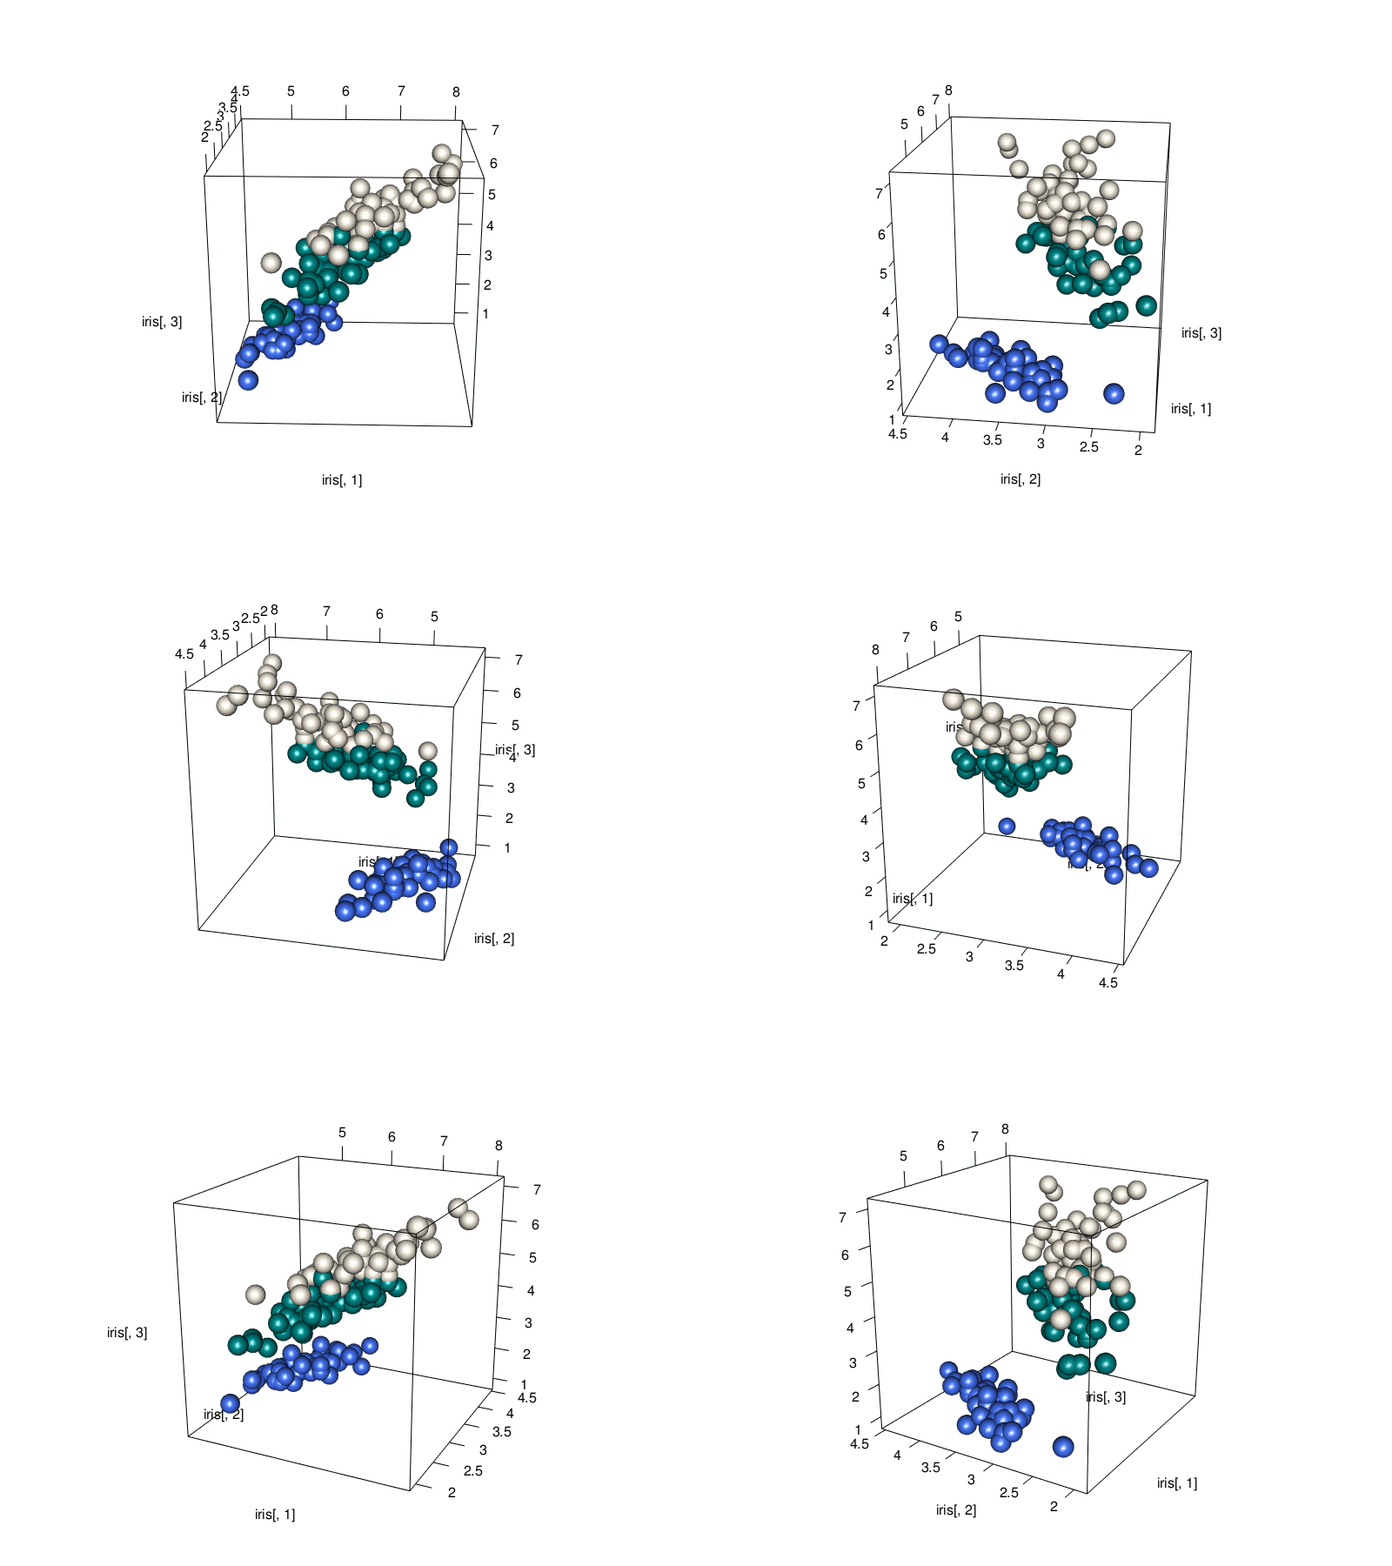
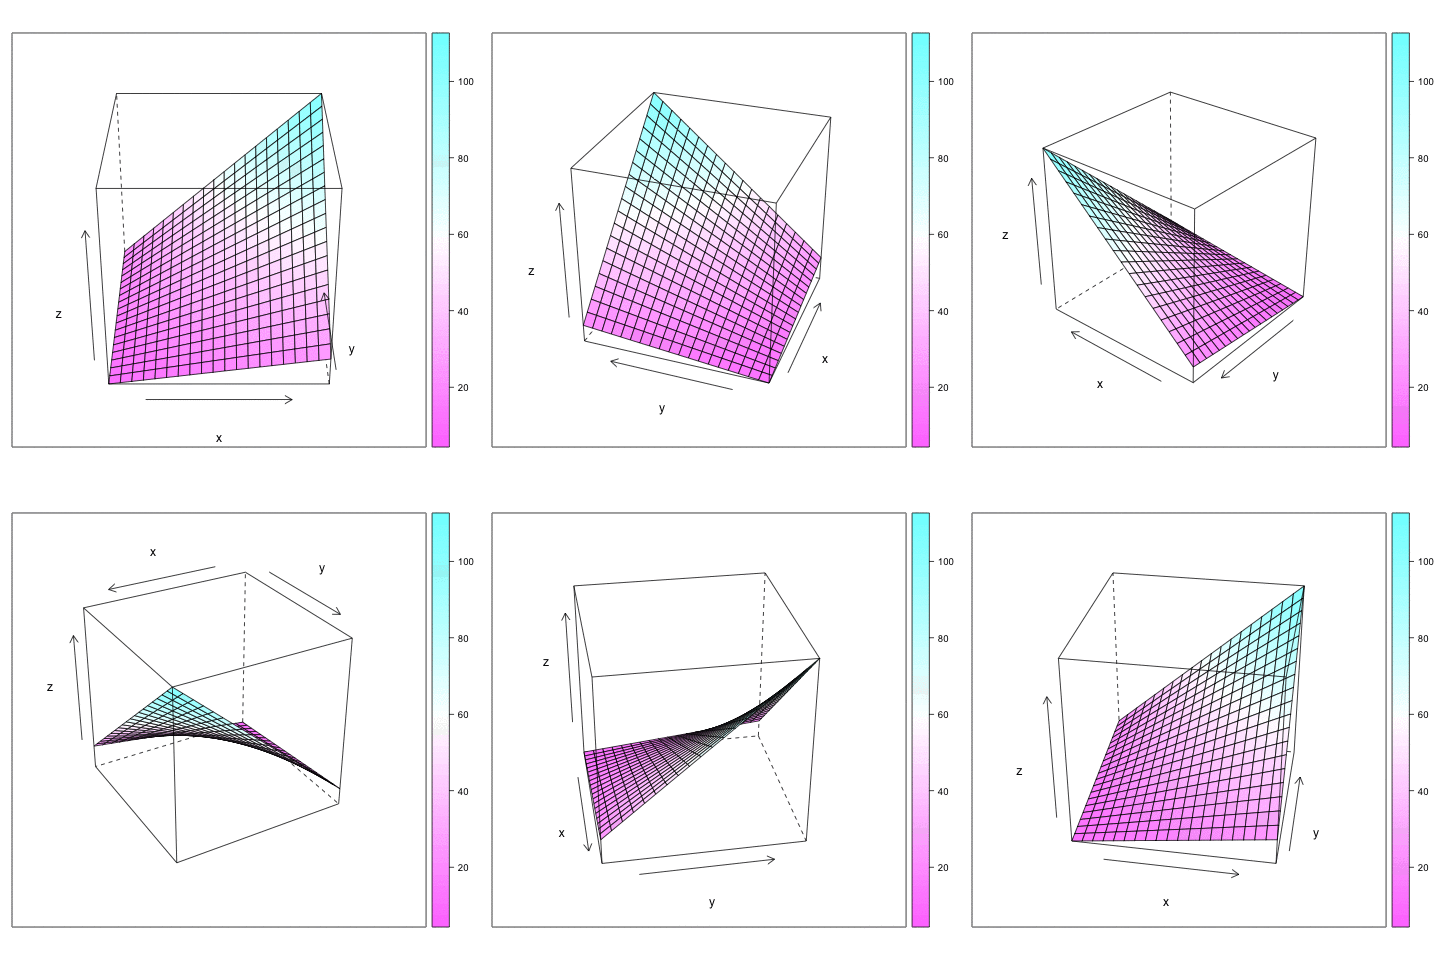
An animated chart displays several chart states one after the other.

It must not be confounded with an interactive chart that allows interaction like zooming or hovering.
This section describes 2 methods to build animations with R.

The first method builds many png images and concatenate them in a gif using image magick. The second relies on the gganimate package
that automatically builds the animation for you.

Note: plotly can be another useful tool for animating graphs.
Build animation directly with gganimate

The gganimate library is a ggplot2 extension that allows to easily create animation from your data. Basically it allows to provide a frame (the step in the animation) as another aesthetic.


Concatenate .png images with Image Magick

Image Magick is a software that allows to work with images in command lines. You can create and output a set of images doing a loop in R. Then, give all these images to Image magick and it will convert them into a .gif format.

Related chart types


Ggplot2
Animation
Interactivity
3D
Caveats
Data art