Boxplot can be dangerous: the exact distribution of each group is hidden behind boxes as explained in data-to-viz.
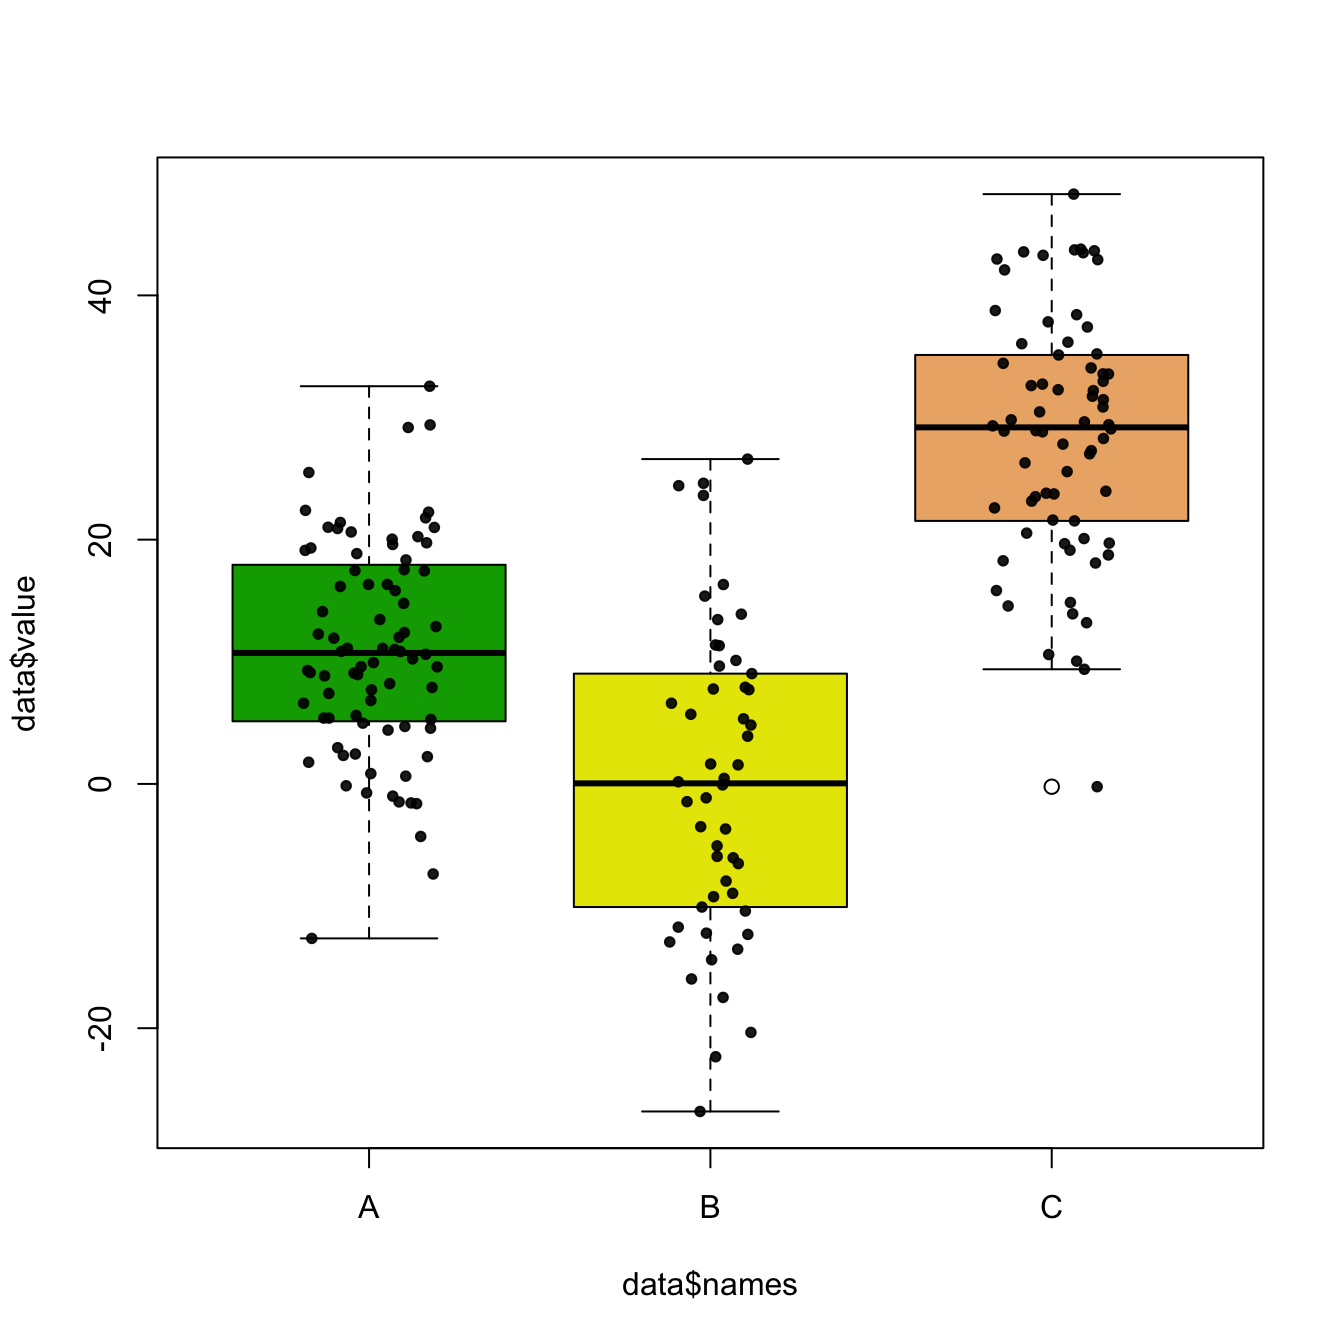
If the amount of observation is not too high, you can add individual observations on top of boxes, using jittering to avoid dot overlap.
In base R, it is done manually creating a function that adds dot one by one, computing a random X position for all of them.
# Create data
names <- c(rep("A", 80) , rep("B", 50) , rep("C", 70))
value <- c( rnorm(80 , mean=10 , sd=9) , rnorm(50 , mean=2 , sd=15) , rnorm(70 , mean=30 , sd=10) )
data <- data.frame(names,value)

# Basic boxplot
boxplot(data$value ~ data$names , col=terrain.colors(4) )

# Add data points
mylevels <- levels(data$names)
levelProportions <- summary(data$names)/nrow(data)
for(i in 1:length(mylevels)){

  thislevel <- mylevels[i]
  thisvalues <- data[data$names==thislevel, "value"]

  # take the x-axis indices and add a jitter, proportional to the N in each level
  myjitter <- jitter(rep(i, length(thisvalues)), amount=levelProportions[i]/2)
  points(myjitter, thisvalues, pch=20, col=rgb(0,0,0,.9))

}