maps package
The maps package is the best source of geospatial data in R.
The whole list of offered data is available typing:
help(package='maps').
It includes:
-
World:
world,world.cities,lakes -
US: states,
county,state,usa - France:
france - Italy:
italy - New zealand:
nz
The code below shows how to use one of this geospatial object.
# Load library
library(maps)
# Check all available geospatial objects:
# help(package='maps')
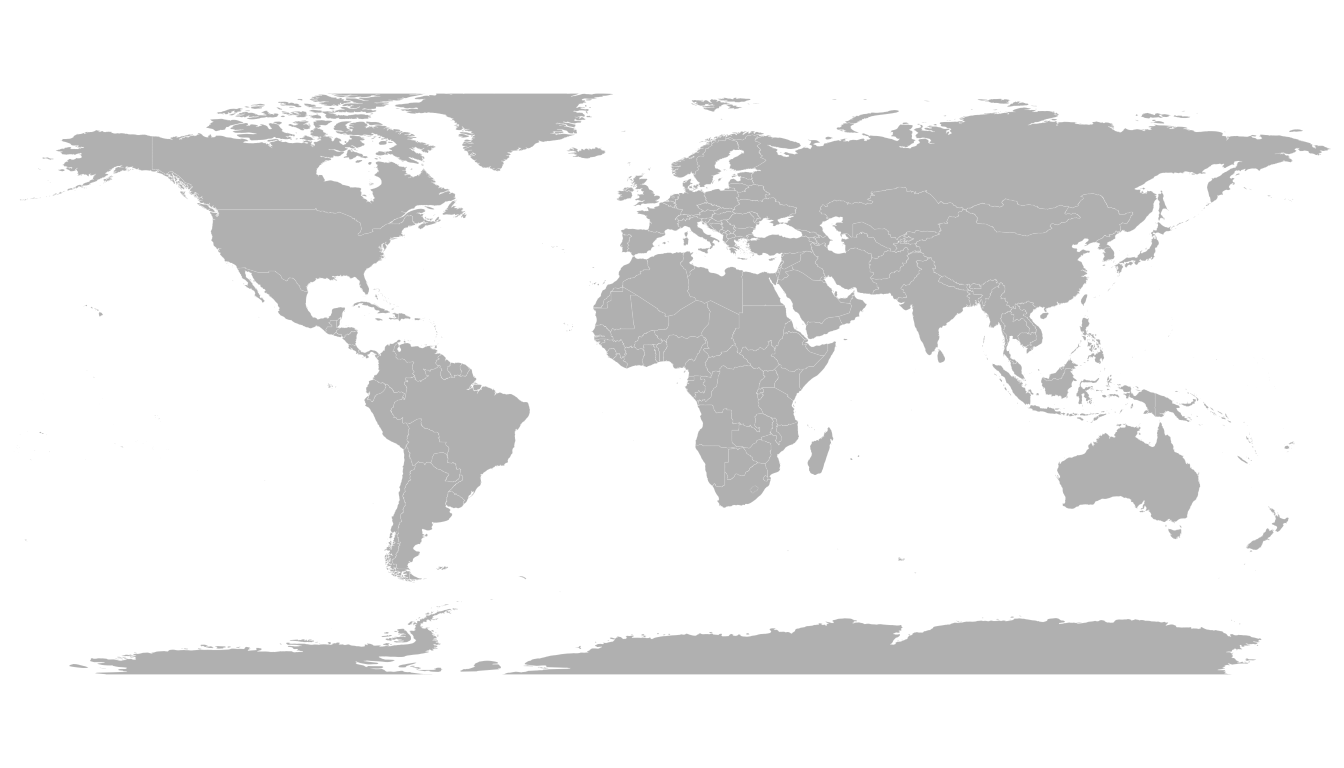
# Map of the world:
map('world',col="grey", fill=TRUE, bg="white", lwd=0.05, mar=rep(0,4),border=0, ylim=c(-80,80) )mapdata package
The
mapdata
package extends the maps package with more geospatial
datasets:
chinajapan-
Other world versions like pacific Centric
(
world2Hires)
See complete list with help(package='mapdata')
# Load library
library(mapdata)
# Check all available geospatial objects:
# help(package='mapdata')
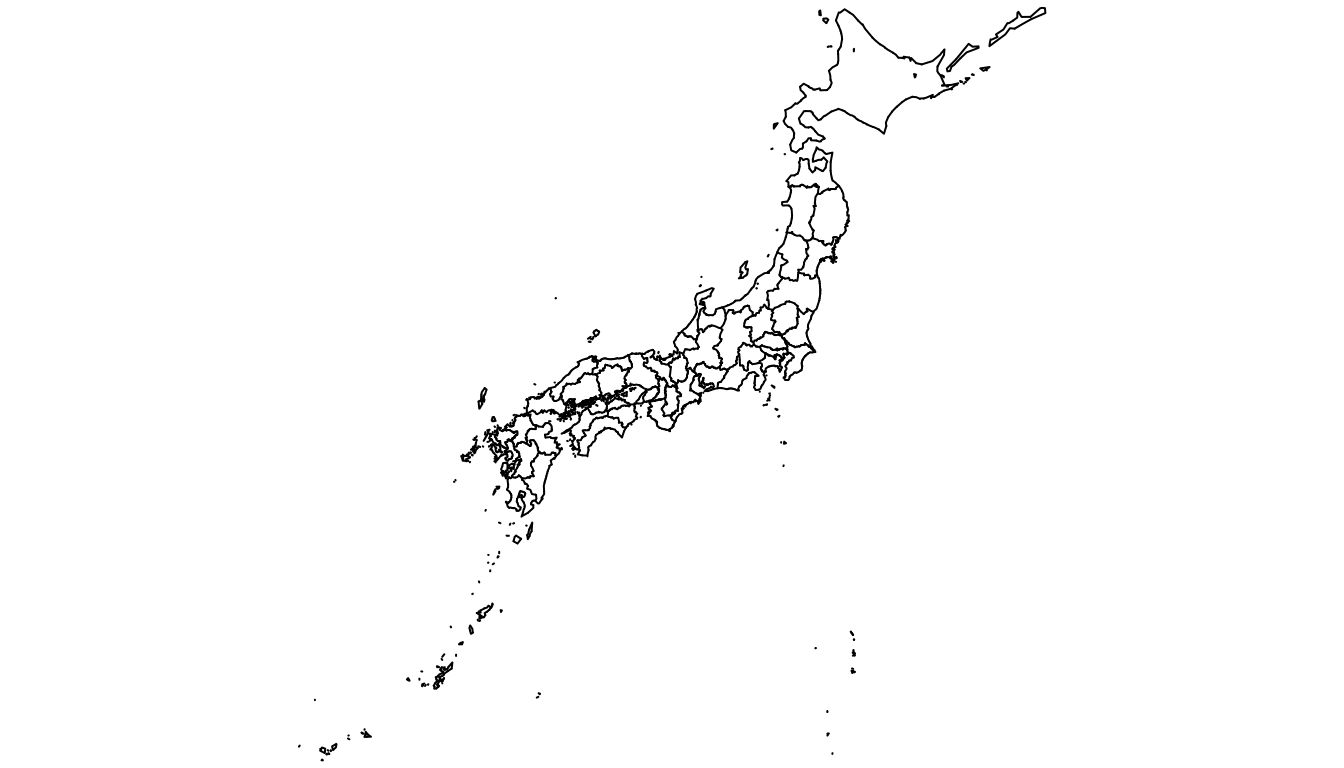
# Map of Japan:
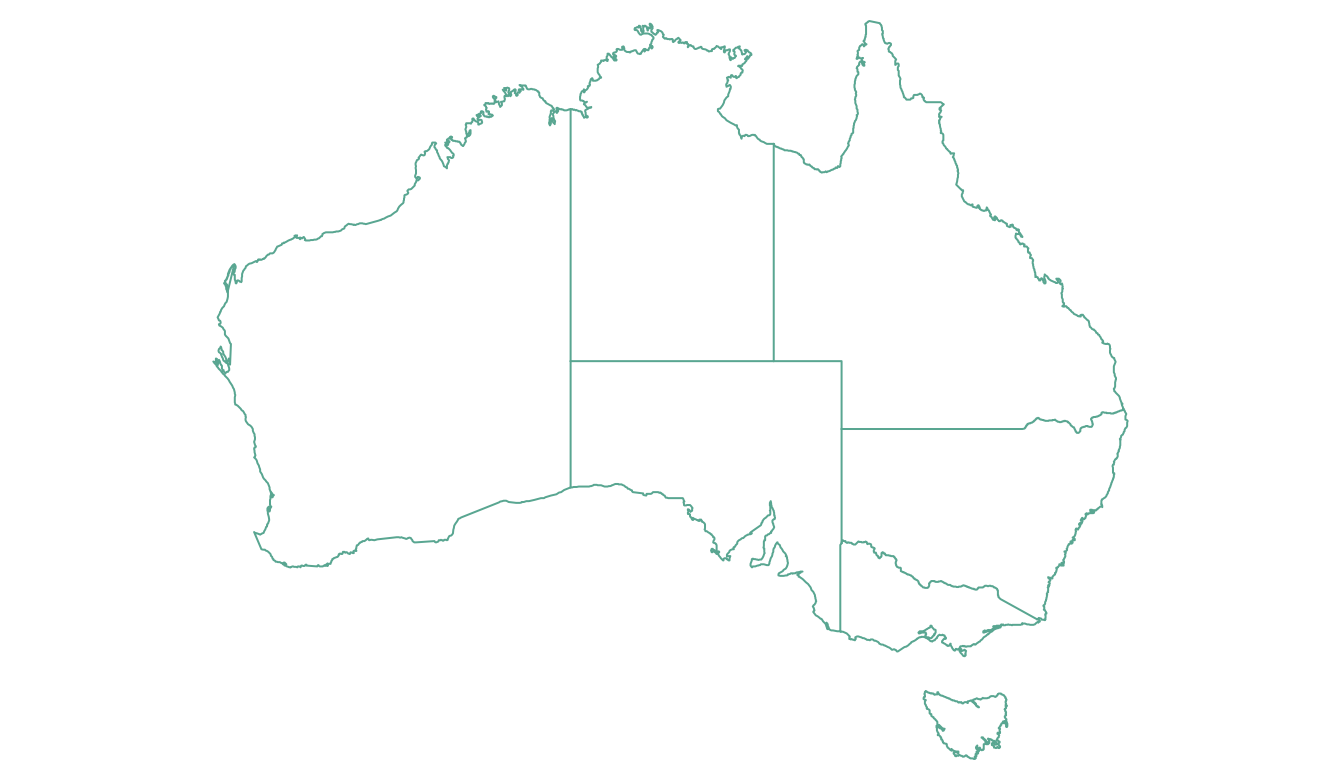
map('japan',col="black", lwd=1, mar=rep(0,4) )oz package
The oz package provides several geospatial object concerning Australia.
Plot the general country using the oz() function, or
states using nsw(), qld() and so on..
Type help(package='oz') for documentation.