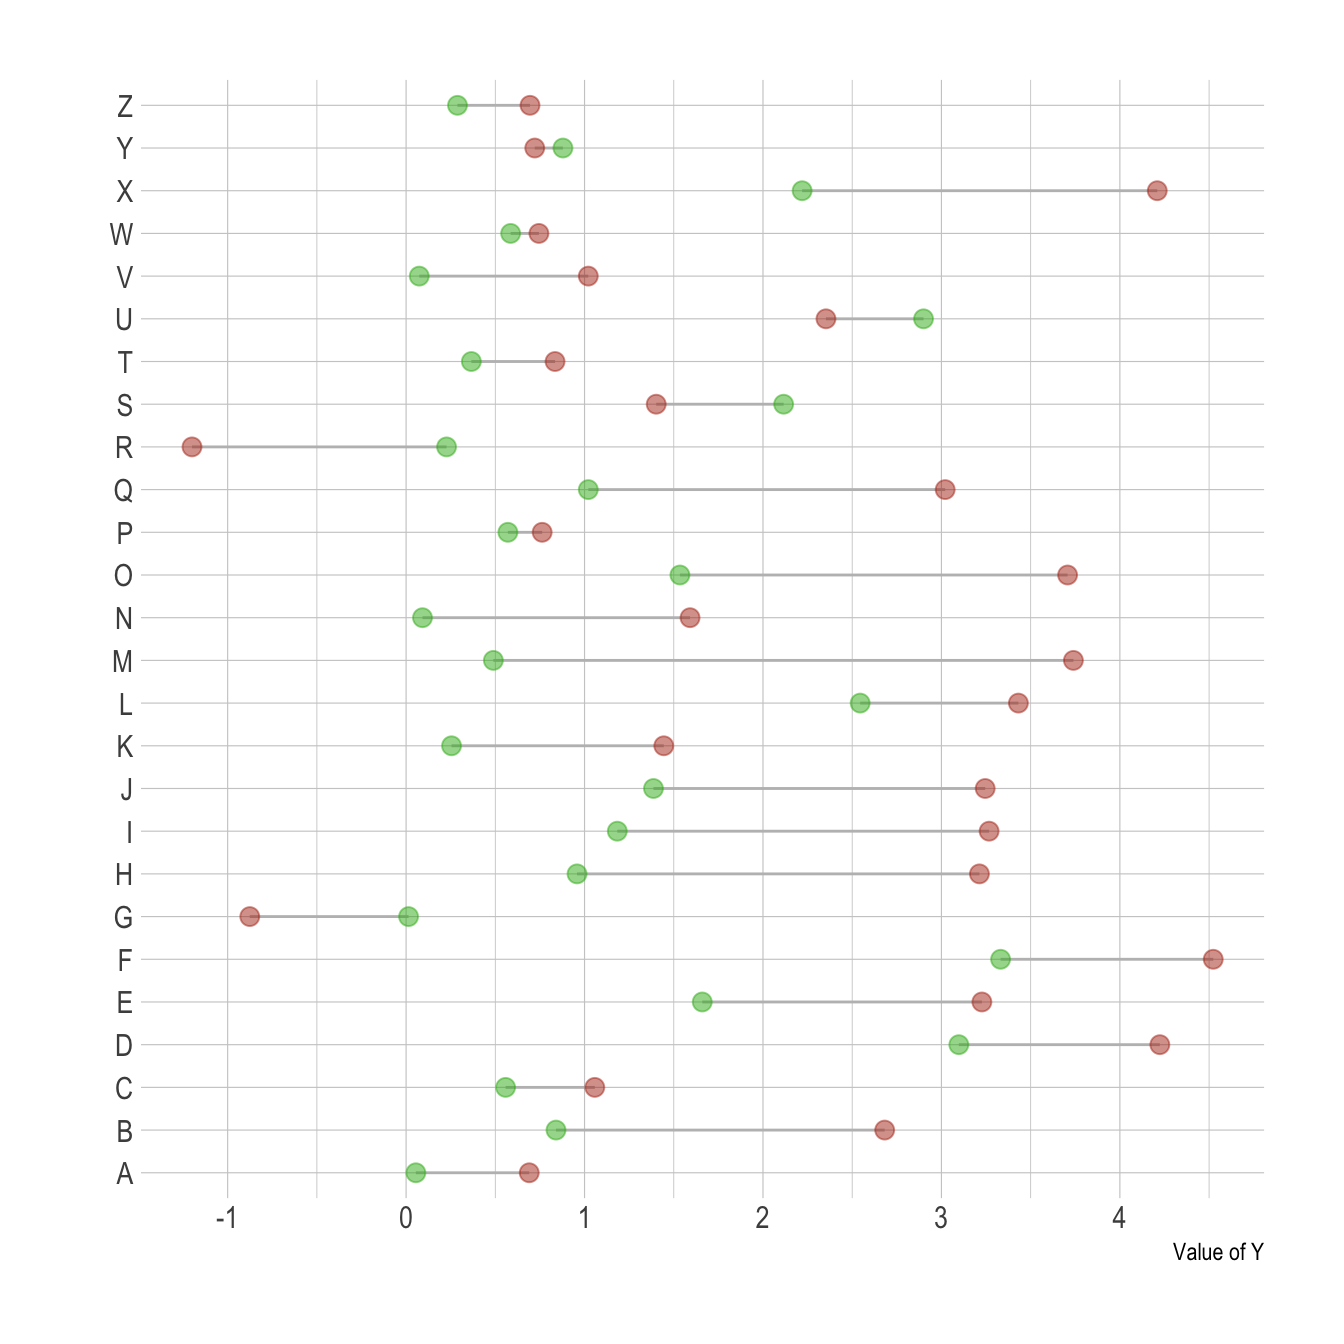
Lollipop plots can be very appropriate when it comes to compare 2 values for several entities.
For each entity, one point is drawn for each variable, with a different color. Their difference is then highlighted using a segment. This type of visualisation is also called Cleveland dot plots.
As usual, it is advised to order your individuals by mean, median, or group difference to give even more insight to the figure.
# Library
library(ggplot2)
library(dplyr)
library(hrbrthemes)

# Create data
value1 <- abs(rnorm(26))*2
data <- data.frame(
  x=LETTERS[1:26],
  value1=value1,
  value2=value1+1+rnorm(26, sd=1)
)

# Reorder data using average? Learn more about reordering in chart #267
data <- data %>%
  rowwise() %>%
  mutate( mymean = mean(c(value1,value2) )) %>%
  arrange(mymean) %>%
  mutate(x=factor(x, x))

# Plot
ggplot(data) +
  geom_segment( aes(x=x, xend=x, y=value1, yend=value2), color="grey") +
  geom_point( aes(x=x, y=value1), color=rgb(0.2,0.7,0.1,0.5), size=3 ) +
  geom_point( aes(x=x, y=value2), color=rgb(0.7,0.2,0.1,0.5), size=3 ) +
  coord_flip()+
  theme_ipsum() +
  theme(
    legend.position = "none",
  ) +
  xlab("") +
  ylab("Value of Y")
What’s next
The lollipop chart is one of my favourite. There is so much to do with
it and it is under-utilized in favor of barplot. Visit the
dedicated section for more examples
produced with R, or
data-to-viz
to learn about the available variations and caveats to avoid.


