Lollipop plot


A lollipop plot is basically a barplot, where the bar is transformed in a line and a dot. It shows the relationship between a numeric and a categorical variable. This page displays many lollipop plots made with R with their source code.

Ggplot2

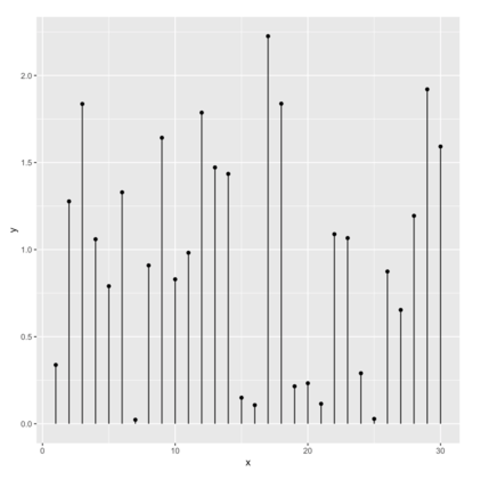
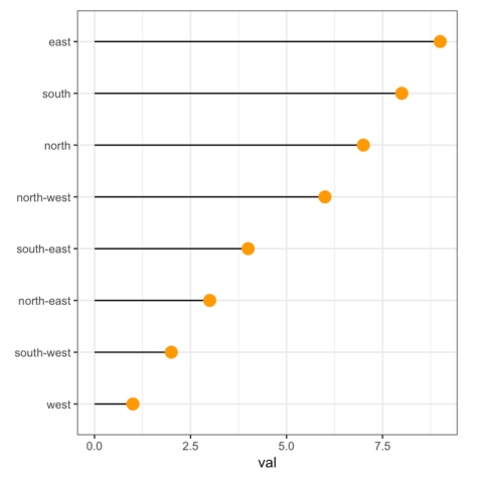
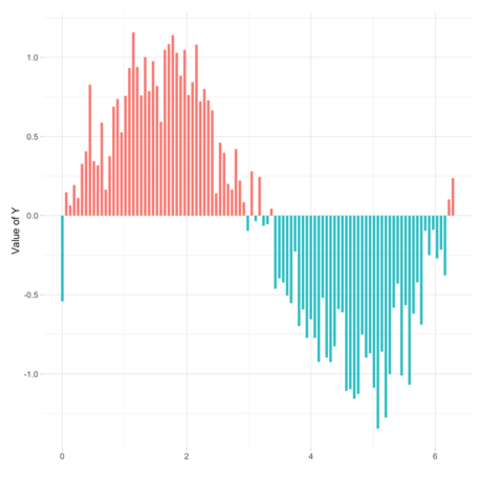
Lollipop charts can be created using ggplot2: the trick is to combine geom_point() for the dots with geom_segment() for the stems. See this basic example to see how to proceed.

🌐 From the web

The web is full of astonishing R charts made by awesome bloggers. The R graph gallery tries to display some of the best creations and explain how their source code works. If you want to display your work here, please drop me a word or even better, submit a Pull Request!

Related chart types


Barplot
Spider / Radar
Wordcloud
Parallel
Lollipop
Circular Barplot