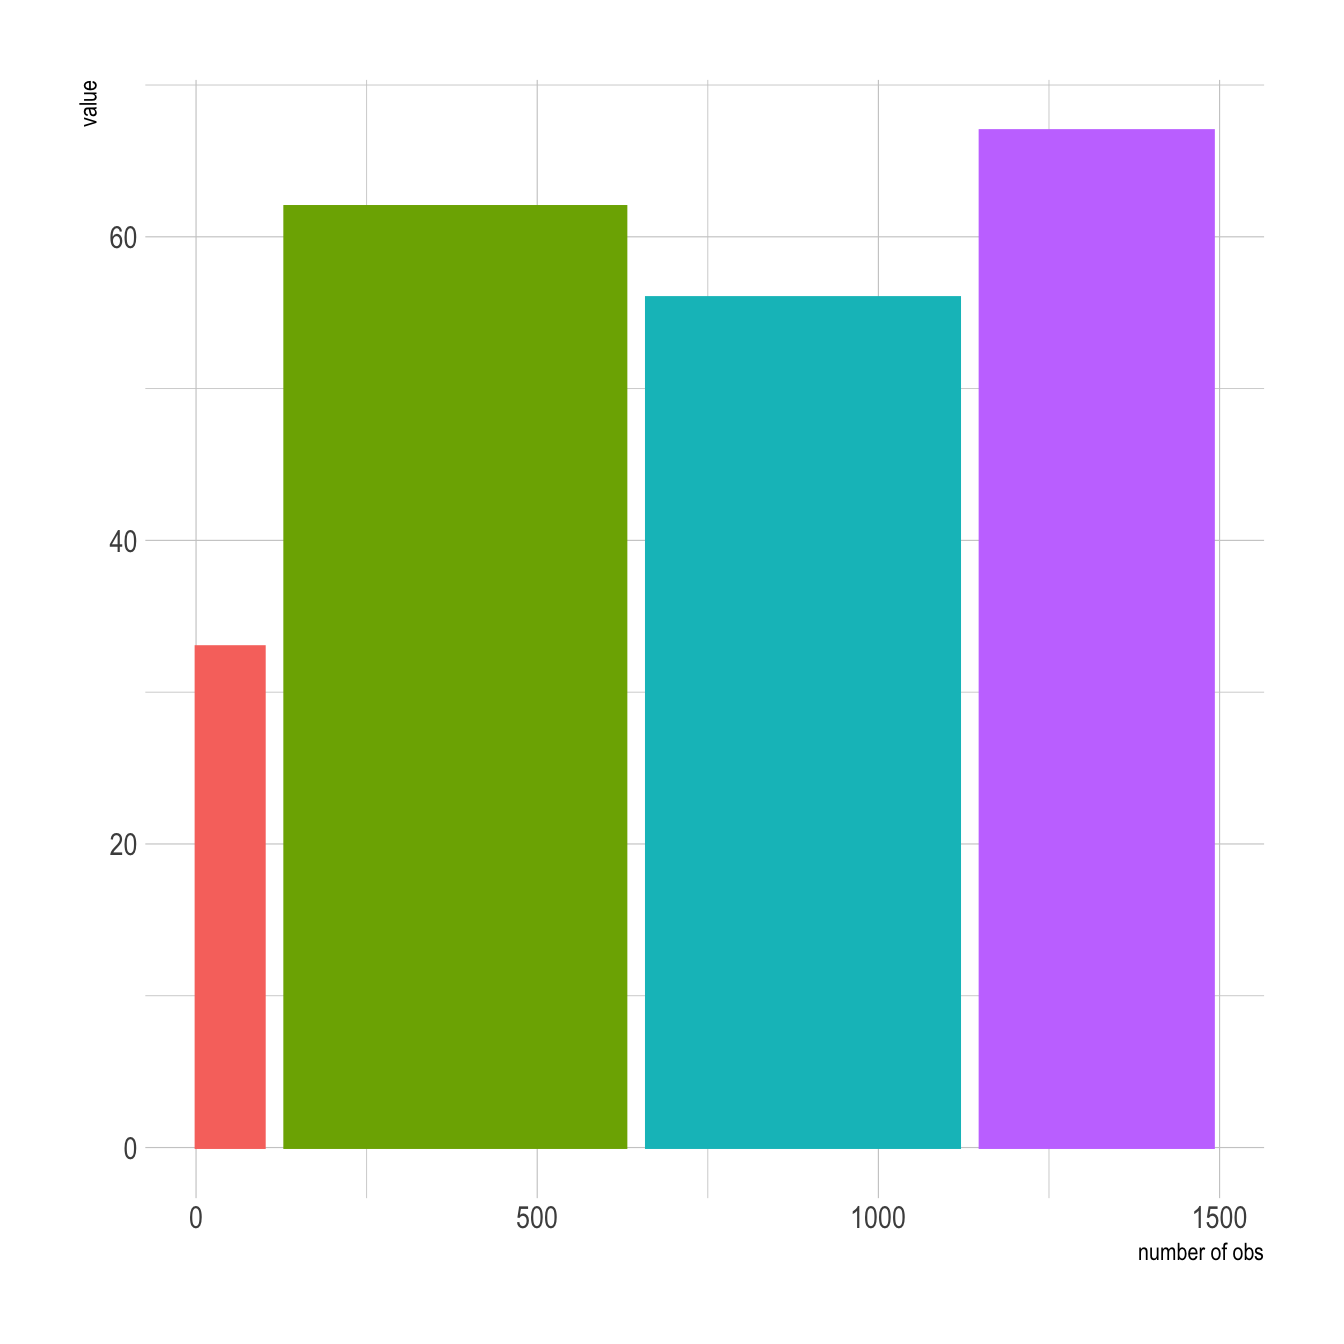
This example shows how to customize bar width in your barchart. It can be used to show the sample size hidden between each category.
It is not possible to draw that kind of chart using
geom_bar() directly. You need to compute manually the
position of each bar extremity using the
cumsum() function, and plot the result using
geom_rect().
Note: if you know what the distribution behind each bar is, don’t do a barplot, show it.
# Load ggplot2
library(ggplot2)
library(hrbrthemes) # for style

# make data
data <- data.frame(
  group=c("A ","B ","C ","D ") ,
  value=c(33,62,56,67) ,
  number_of_obs=c(100,500,459,342)
)

# Calculate the future positions on the x axis of each bar (left border, central position, right border)
data$right <- cumsum(data$number_of_obs) + 30*c(0:(nrow(data)-1))
data$left <- data$right - data$number_of_obs

# Plot
ggplot(data, aes(ymin = 0)) +
    geom_rect(aes(xmin = left, xmax = right, ymax = value, colour = group, fill = group)) +
    xlab("number of obs") +
    ylab("value") +
    theme_ipsum() +
theme(legend.position="none") 


