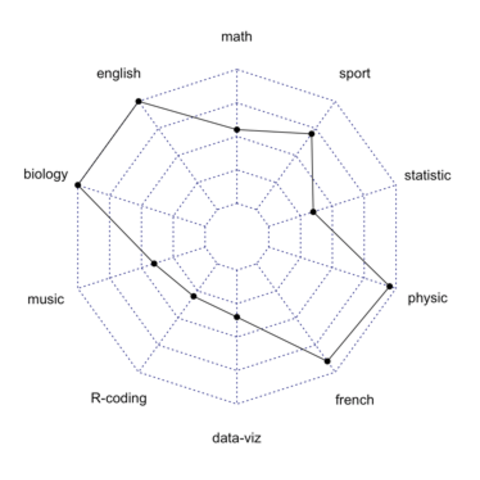
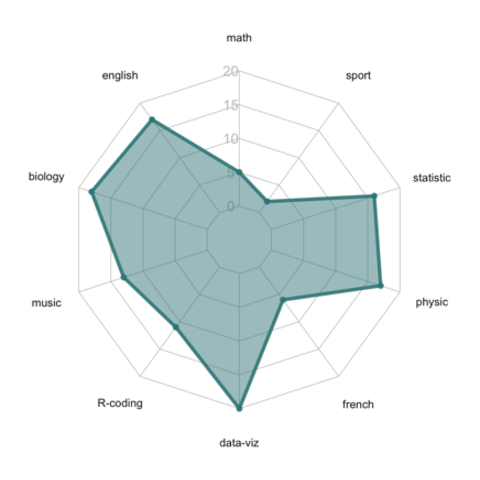
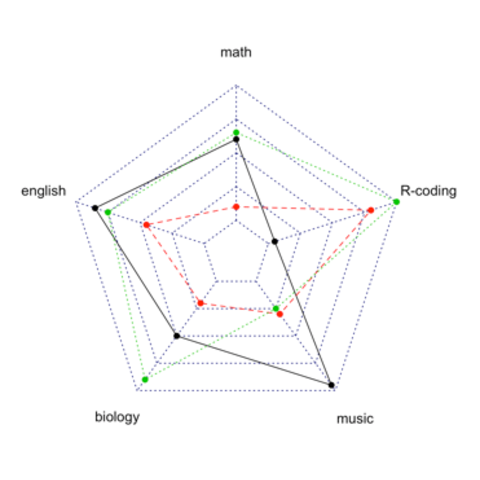
A
          radar or
          spider or
          web chart
          is a two-dimensional chart type designed to plot one or more series of
          values over multiple quantitative variables. It has several downsides
          and should be
          used with care. In R, the fmsb library is the best tool to build it.
        
fmsb library
        
          The fmsb package allows to build radar chart in R. Next
          examples explain how to format your data to build a basic version, and
          what are the available option to customize the chart appearance.
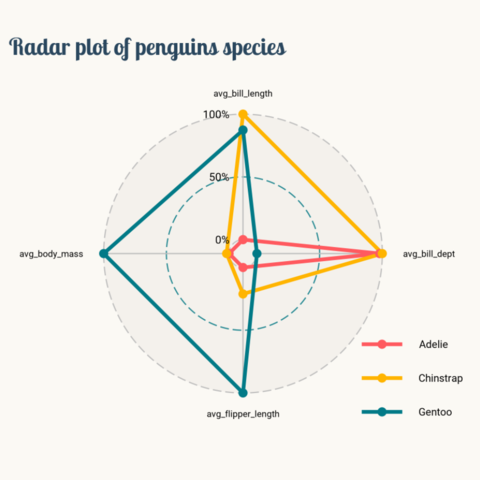
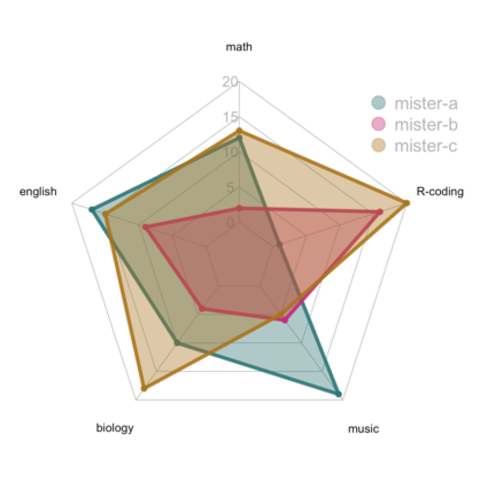
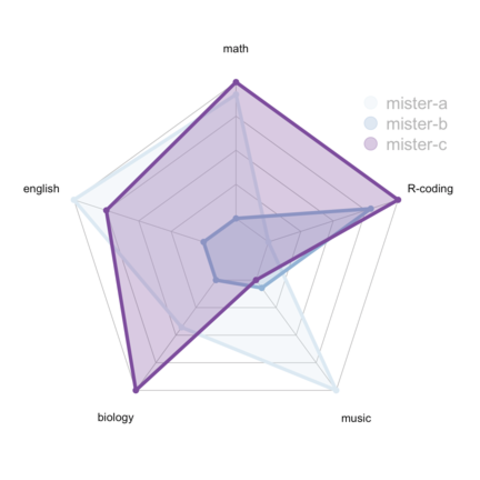
        
fmsb library
        
          It is totally doable to show several groups on the same spider chart,
          still using the fmsb package. The examples below will
          guide you through this process. But keep in mind that displaying more
          than 2 or 3 groups will result in a cluttered and unreadable figure. (
          read more
          )
        
There is a lot of criticism going around spider chart. Before using it in a project, you probably want to learn more about it.
Why it's dangerousThe web is full of astonishing R charts made by awesome bloggers. The R graph gallery tries to display some of the best creations and explain how their source code works. If you want to display your work here, please drop me a word or even better, submit a Pull Request!
          Note: the radar chart examples below are built with
          ggplot2, which is a nice addition to the
          fmsb examples above.