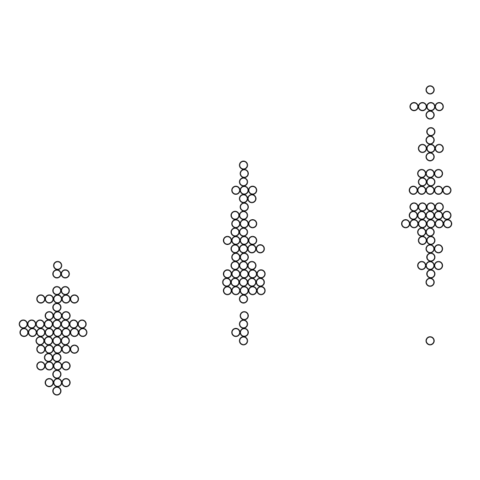
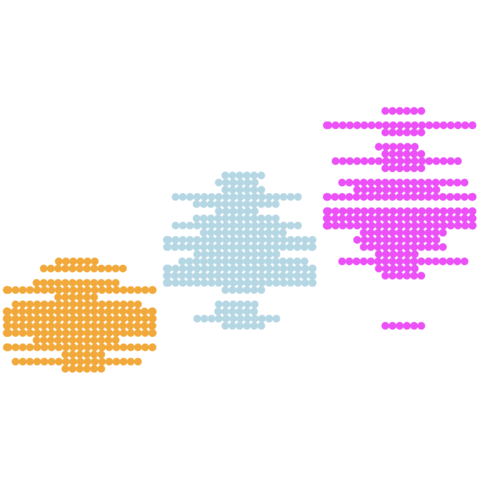
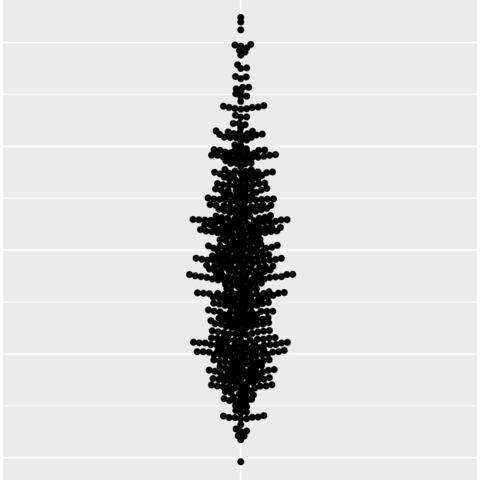
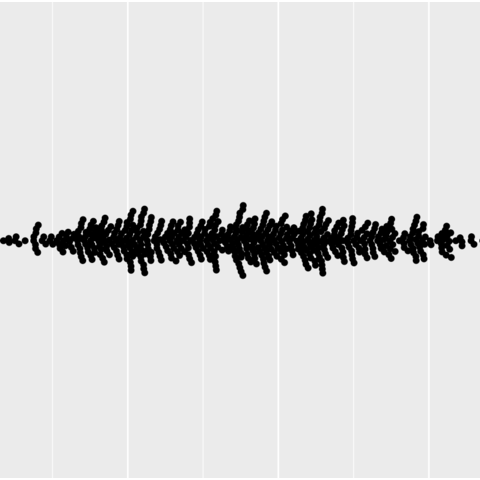
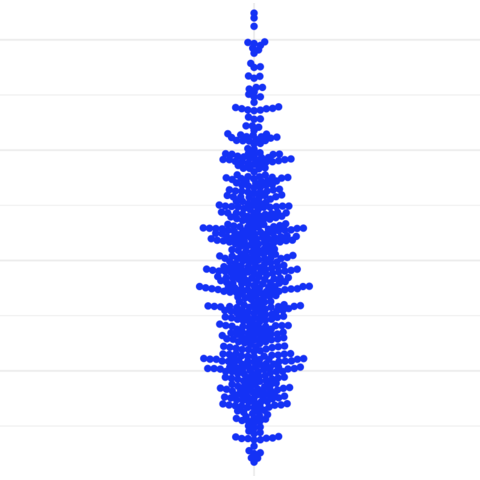
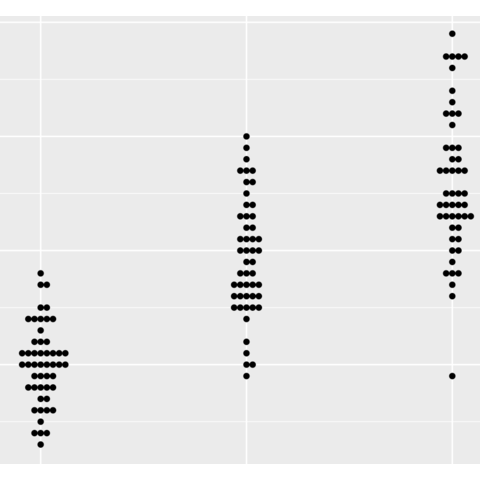
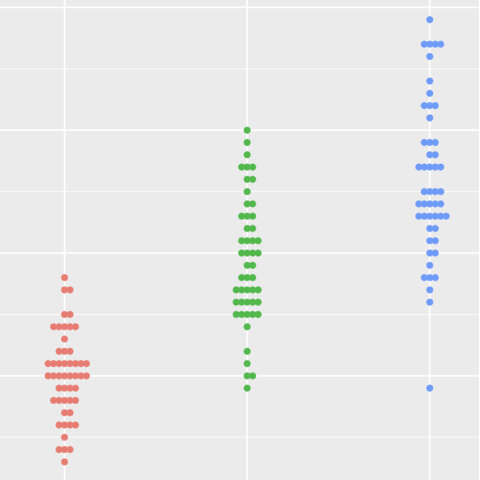
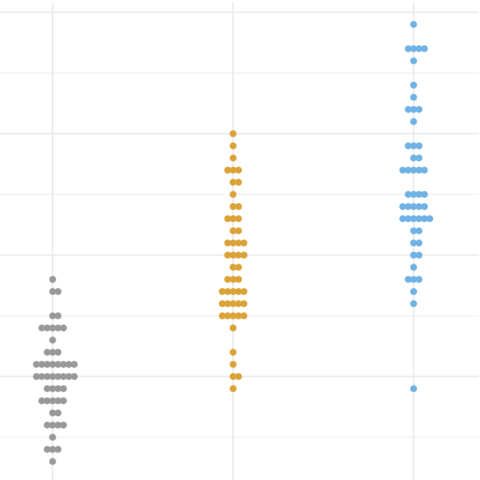
Beeswarm plot


A beeswarm plot, also known as a swarmplot, is a graph type that presents individual data points without overlap, creating a distinct "swarming" effect reminiscent of a bee swarm.
In this section, we present various examples implemented using R and the beeswarm and ggbeeswarm packages.

The beeswarm package.

This simple-to-use package allows to build beeswarm plots in R with just one or two lines of code.

It is a great choice for simple and quick visualizations. The package is available on CRAN, so you can install it with install.packages("beeswarm").

The ggbeeswarm package.

This package is a ggplot2 extension that allows to build beeswarm plots directly from the ggplot2 package.

It is a great choice for highly customized visualizations since it allows us to use the ggplot2 syntax and features. The package is available on CRAN, so you can install it with install.packages("ggbeeswarm").

Related chart types


Violin
Density
Histogram
Boxplot
Ridgeline