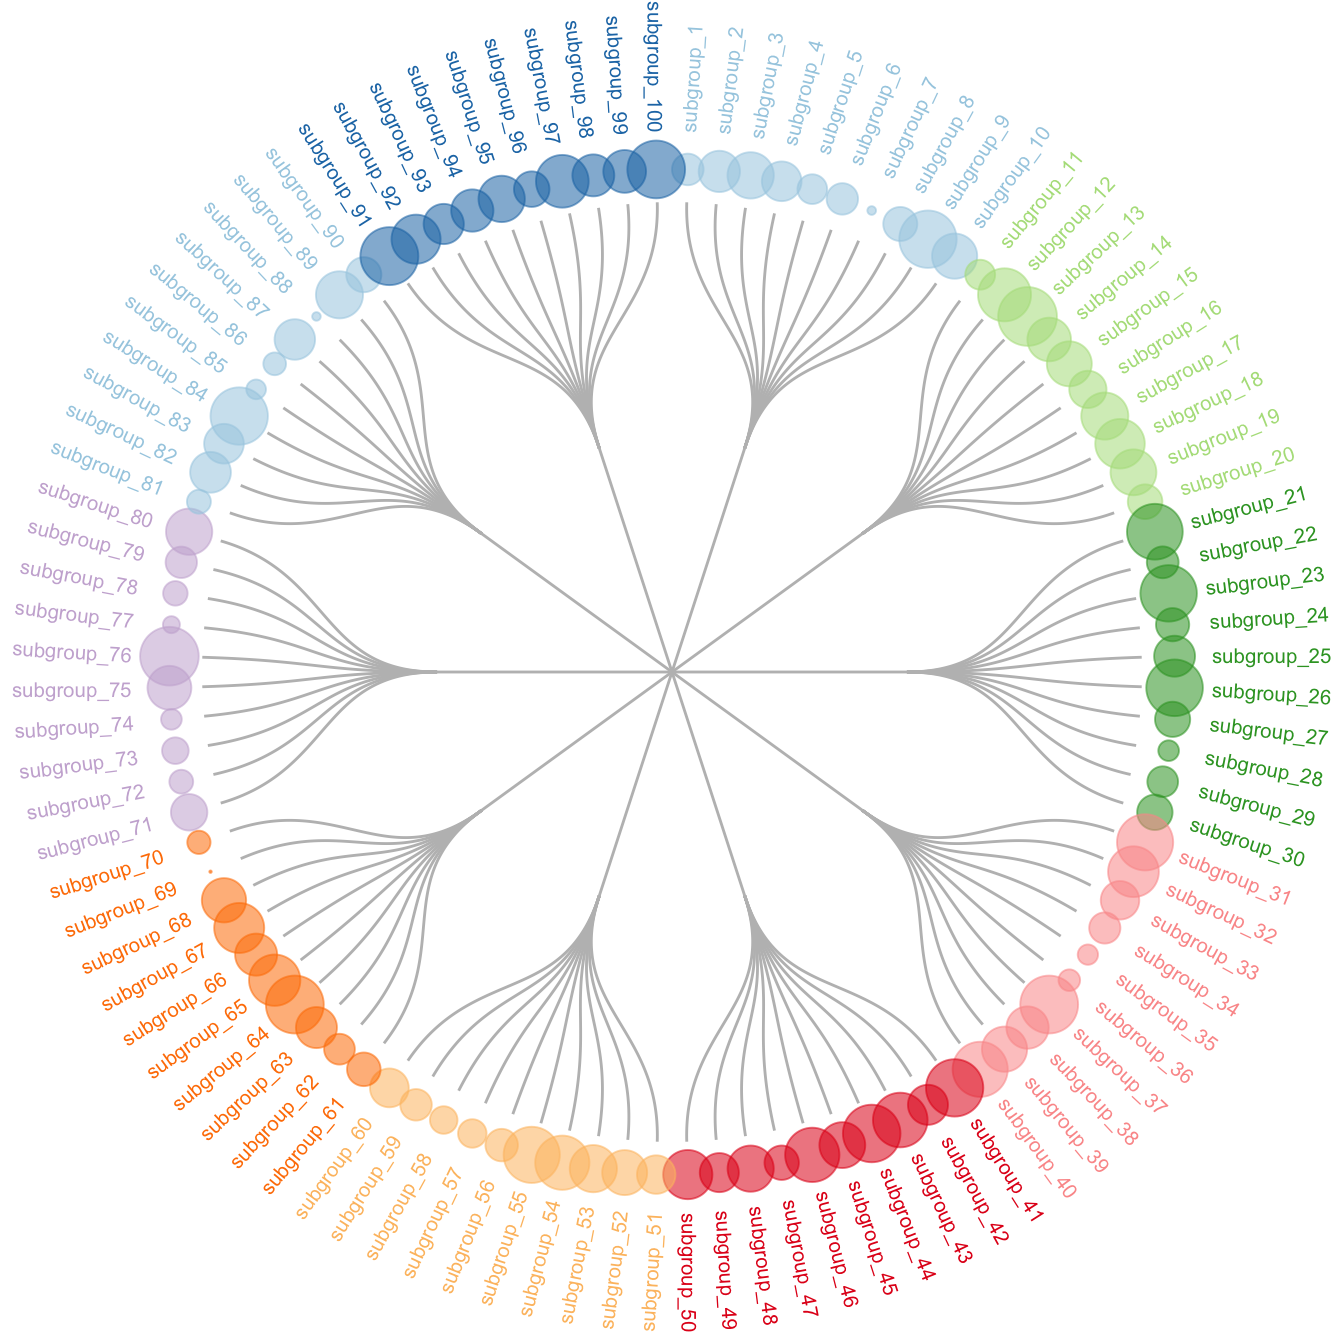
The circular dendrogram of the ggraph library deserves
its own page because it can be a bit tricky to adjust the labels.
Indeed they need to have a good angle, be flipped upside down on the
left part of the chart, and their alignment needs to be adjusted as
well.
The following piece of code should allow you to display them correctly as shown beside. Note that the graph #334 gives the basis of dendrogram with ggraph, and that graph #335 presents a few possible customizations.
# Libraries
library(ggraph)
library(igraph)
library(tidyverse)
library(RColorBrewer)
# create a data frame giving the hierarchical structure of your individuals
d1=data.frame(from="origin", to=paste("group", seq(1,10), sep=""))
d2=data.frame(from=rep(d1$to, each=10), to=paste("subgroup", seq(1,100), sep="_"))
edges=rbind(d1, d2)

# create a vertices data.frame. One line per object of our hierarchy
vertices = data.frame(
  name = unique(c(as.character(edges$from), as.character(edges$to))) ,
  value = runif(111)
)
# Let's add a column with the group of each name. It will be useful later to color points
vertices$group = edges$from[ match( vertices$name, edges$to ) ]


#Let's add information concerning the label we are going to add: angle, horizontal adjustement and potential flip
#calculate the ANGLE of the labels
vertices$id=NA
myleaves=which(is.na( match(vertices$name, edges$from) ))
nleaves=length(myleaves)
vertices$id[ myleaves ] = seq(1:nleaves)
vertices$angle= 90 - 360 * vertices$id / nleaves

# calculate the alignment of labels: right or left
# If I am on the left part of the plot, my labels have currently an angle < -90
vertices$hjust<-ifelse( vertices$angle < -90, 1, 0)

# flip angle BY to make them readable
vertices$angle<-ifelse(vertices$angle < -90, vertices$angle+180, vertices$angle)

# Create a graph object
mygraph <- graph_from_data_frame( edges, vertices=vertices )

# Make the plot
ggraph(mygraph, layout = 'dendrogram', circular = TRUE) +
  geom_edge_diagonal(colour="grey") +
  scale_edge_colour_distiller(palette = "RdPu") +
  geom_node_text(aes(x = x*1.15, y=y*1.15, filter = leaf, label=name, angle = angle, hjust=hjust, colour=group), size=2.7, alpha=1) +
  geom_node_point(aes(filter = leaf, x = x*1.07, y=y*1.07, colour=group, size=value, alpha=0.2)) +
  scale_colour_manual(values= rep( brewer.pal(9,"Paired") , 30)) +
  scale_size_continuous( range = c(0.1,10) ) +
  theme_void() +
  theme(
    legend.position="none",
    plot.margin=unit(c(0,0,0,0),"cm"),
  ) +
  expand_limits(x = c(-1.3, 1.3), y = c(-1.3, 1.3))
Session info
Some people reported issues with this example so I’m printing the session info to help tracking the issue.
sessionInfo()## R version 3.5.3 (2019-03-11)
## Platform: x86_64-apple-darwin15.6.0 (64-bit)
## Running under: macOS Mojave 10.14.6
##
## Matrix products: default
## BLAS: /Library/Frameworks/R.framework/Versions/3.5/Resources/lib/libRblas.0.dylib
## LAPACK: /Library/Frameworks/R.framework/Versions/3.5/Resources/lib/libRlapack.dylib
##
## locale:
## [1] en_US.UTF-8/en_US.UTF-8/en_US.UTF-8/C/en_US.UTF-8/en_US.UTF-8
##
## attached base packages:
## [1] stats graphics grDevices utils datasets methods base
##
## other attached packages:
## [1] RColorBrewer_1.1-2 forcats_0.5.1 stringr_1.4.0 dplyr_1.0.6
## [5] purrr_0.3.4 readr_1.4.0 tidyr_1.1.3 tibble_3.1.2
## [9] tidyverse_1.3.1 igraph_1.2.4.1 ggraph_1.0.2 ggplot2_3.3.3
##
## loaded via a namespace (and not attached):
## [1] ggrepel_0.8.0 Rcpp_1.0.1 lubridate_1.7.10 assertthat_0.2.1
## [5] digest_0.6.20 utf8_1.1.4 ggforce_0.2.1 R6_2.4.0
## [9] cellranger_1.1.0 plyr_1.8.4 backports_1.1.4 reprex_2.0.0
## [13] evaluate_0.13 highr_0.8 httr_1.4.2 pillar_1.6.1
## [17] rlang_0.4.11 readxl_1.3.1 rstudioapi_0.13 rmarkdown_1.12
## [21] labeling_0.3 polyclip_1.10-0 munsell_0.5.0 broom_0.7.6
## [25] compiler_3.5.3 modelr_0.1.8 xfun_0.23 pkgconfig_2.0.2
## [29] htmltools_0.3.6 tidyselect_1.1.1 gridExtra_2.3 fansi_0.4.0
## [33] viridisLite_0.3.0 crayon_1.4.1 dbplyr_2.1.1 withr_2.4.2
## [37] MASS_7.3-51.1 grid_3.5.3 jsonlite_1.7.2 gtable_0.3.0
## [41] lifecycle_1.0.0 DBI_1.0.0 magrittr_2.0.1 scales_1.0.0
## [45] cli_2.5.0 stringi_1.4.3 farver_1.1.0 viridis_0.5.1
## [49] fs_1.5.0 xml2_1.3.2 ellipsis_0.3.2 generics_0.0.2
## [53] vctrs_0.3.8 tools_3.5.3 glue_1.4.2 tweenr_1.0.1
## [57] hms_1.1.0 yaml_2.2.0 colorspace_1.4-1 rvest_1.0.0
## [61] knitr_1.33 haven_2.3.1