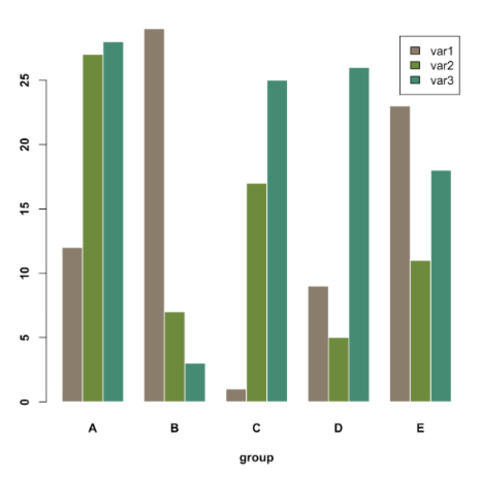
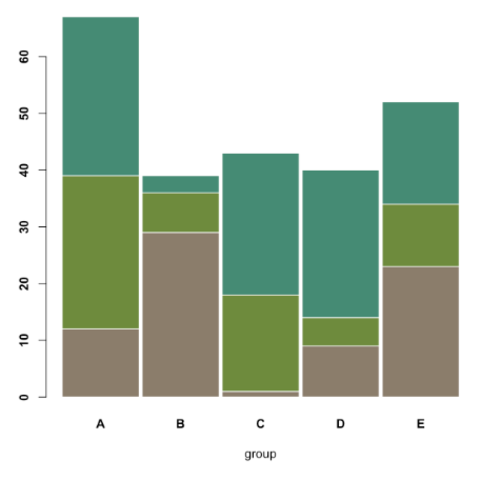
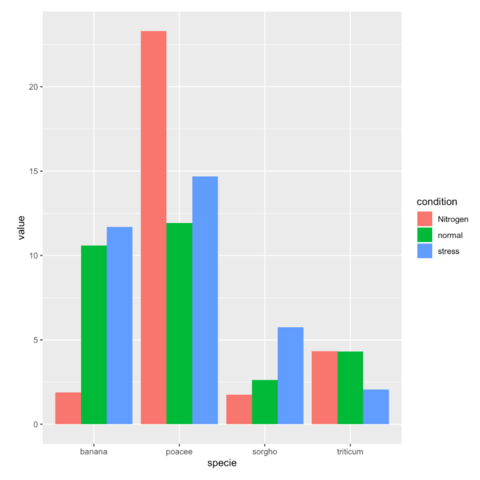
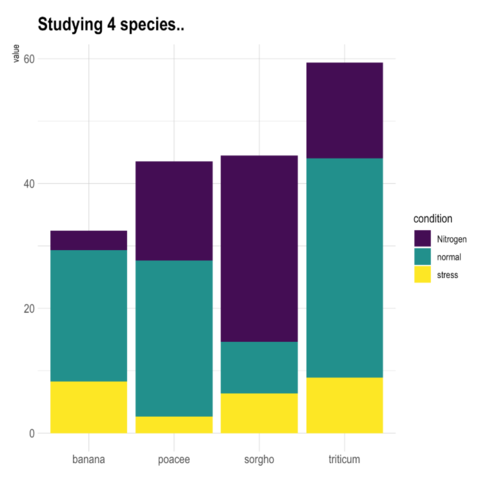
ggplot2ggplot2 is probably the best option to build grouped and stacked barchart. The input data frame requires to have 2 categorical variables that will be passed to the x and fill arguments of the aes() function. Toggling from grouped to stacked is pretty easy thanks to the position argument.


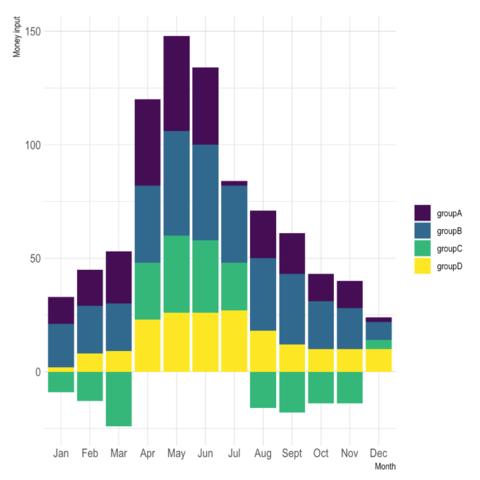
A barchart can look pretty good using a circular layout, even if there are some caveats associated. If it interests you, visit the circular barchart section.
Code Circular section
Stacked area chart are sometimes used to study an evolution using each group on the X axis as a timestamp. There are many alternatives to that, like streamgraph or area chart:
Learn more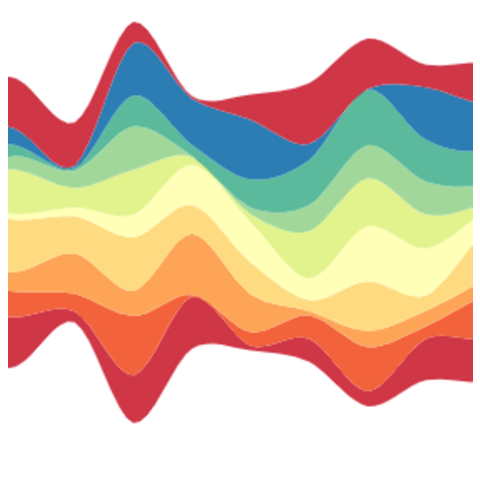
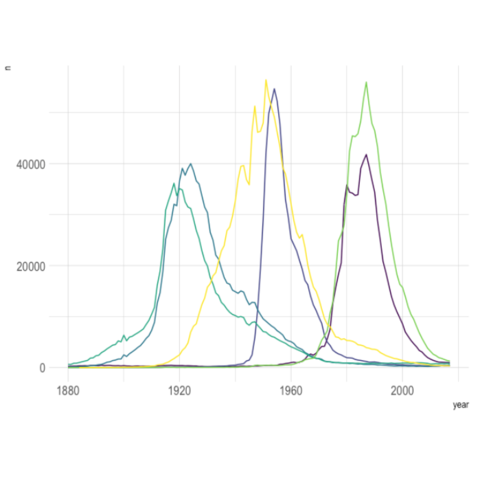
A stacked area chart showing the evolution of a few baby names in the US. Zoom on a specific time frame through brushing. Highlight a specific group by hovering the legend. Double click to unzoom.