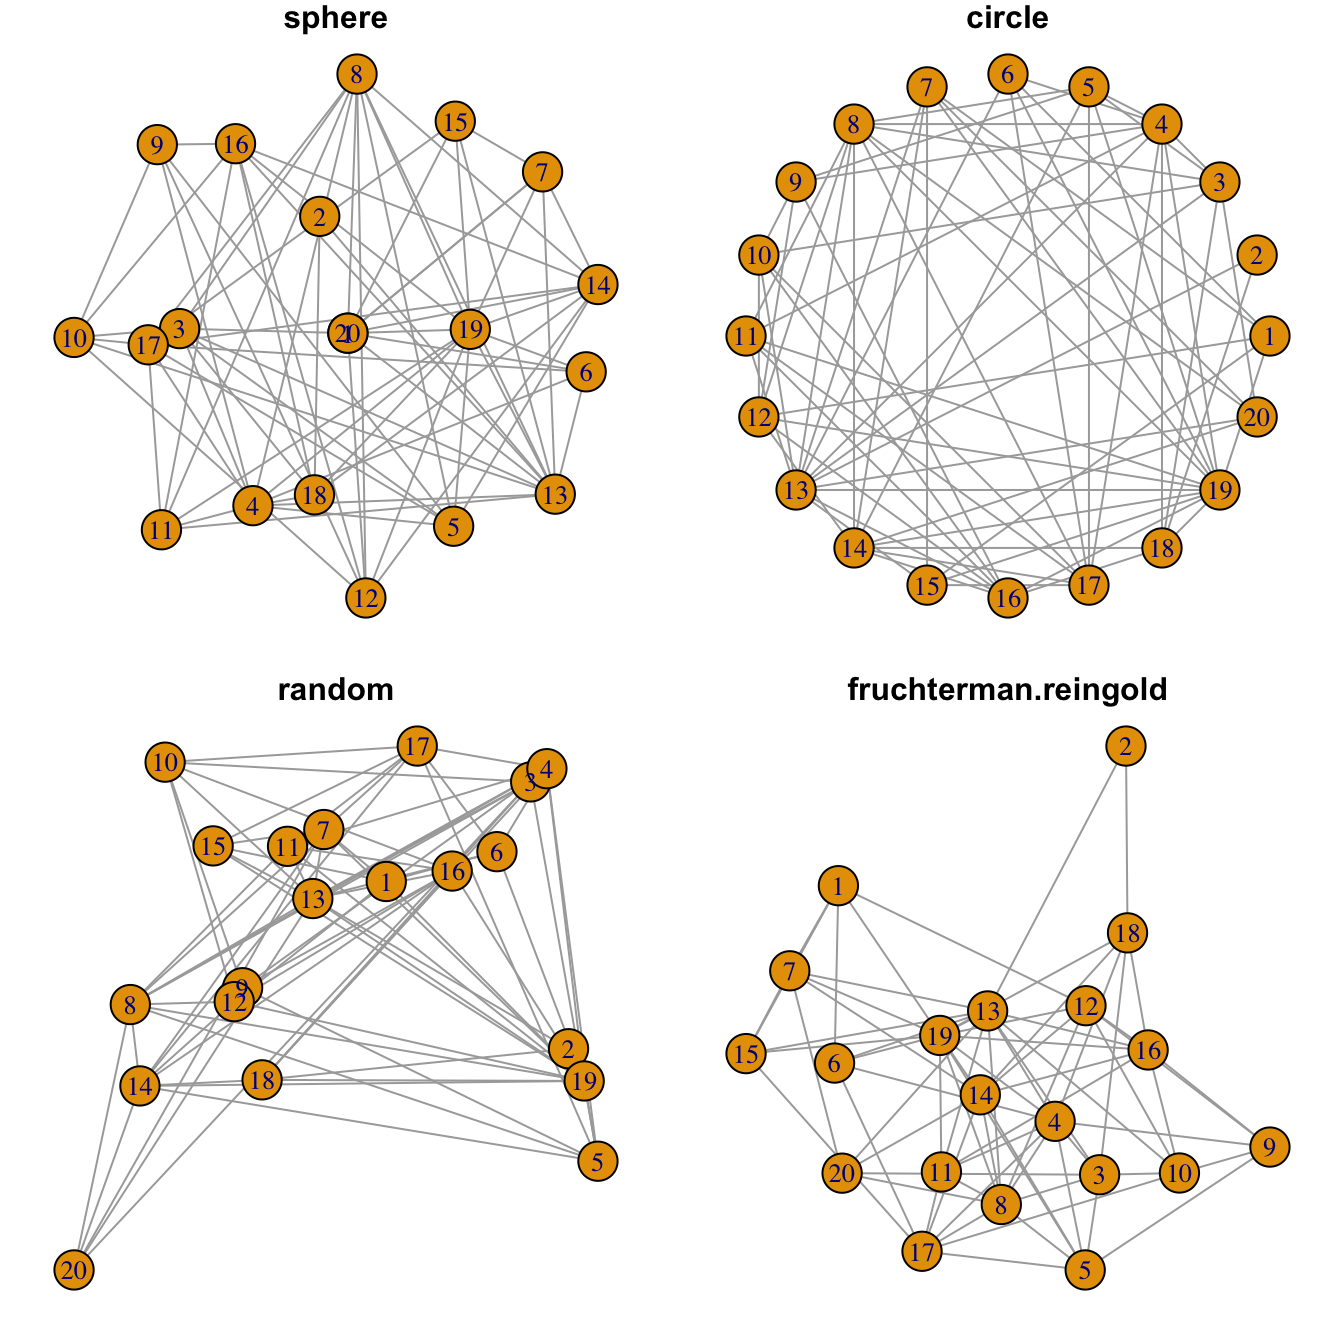
Network layouts are algorithms that return coordinates for each node
in a network. The
igraph library offers several built-in layouts, and a
sample of them is presented here.
Usually, algorithms try to minimize edge crossing and prevent overlap. Edges can have uniform length or not.
Choose your layout using the layout argument. Type
help(layout) to see all the possibilities.
In practice, the fruchterman reingold algorythm is
often used.
# library
library(igraph)

# Create data
data <- matrix(sample(0:1, 400, replace=TRUE, prob=c(0.8,0.2)), nrow=20)
network <- graph_from_adjacency_matrix(data , mode='undirected', diag=F )

# When ploting, we can use different layouts:
par(mfrow=c(2,2), mar=c(1,1,1,1))
plot(network, layout=layout.sphere, main="sphere")
plot(network, layout=layout.circle, main="circle")
plot(network, layout=layout.random, main="random")
plot(network, layout=layout.fruchterman.reingold, main="fruchterman.reingold")

# See the complete list with
# help(layout)