Network graph


Network diagrams (or Graphs) show interconnections between a set of entities. Each entity is represented by a Node (or vertice). Connections between nodes are represented by links (or edges). Three packages are of interest in R: igraph for data preparation and plotting, ggraph for plotting using the grammar of graphic, and networkD3 for interactivity.

Input format and introduction to igraph

Building a network diagram is always complicated since many different input formats are available:

Moreover, you need to know wheter the network you're trying to build is directed or undirected, and weighted or unweighted. In any case, the igraph package is the best tool to read that kind of data and transform it into a graph object that is required to make a chart.

Read full post
Step by step with igraph

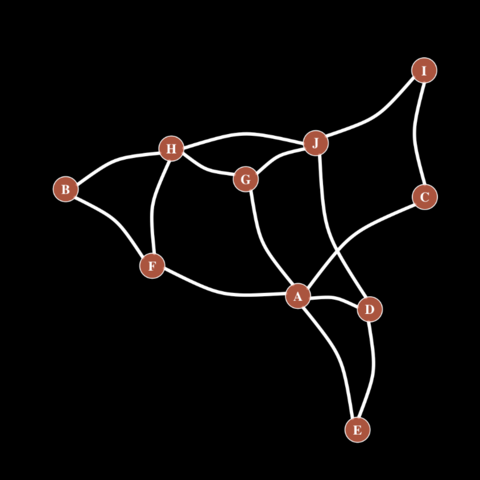
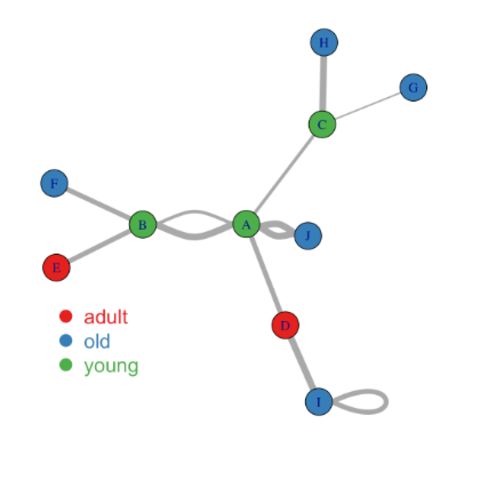
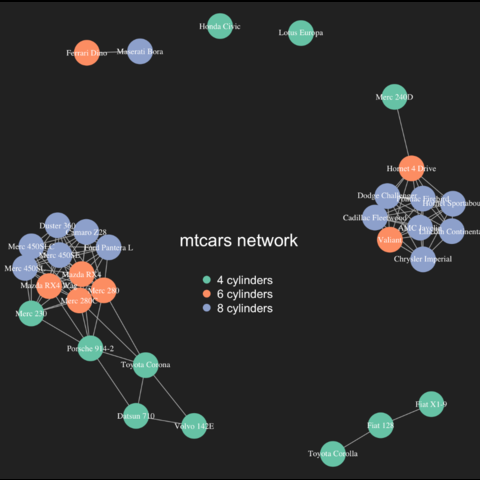
The igraph package is the most important R package when it comes to build network diagrams with R. It basically allows to build any type of network with R. The following examples should allow you to get started and master the most common tasks concerning graph building.
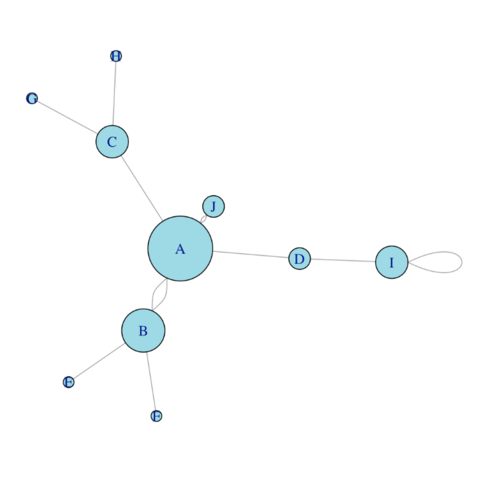


Interactive version

The networkD3 package allows to build interactive network diagrams with R. On the chart below, try to hover a node and drag it to see how it works. You can also scroll to zoom in and out. Visit the corresponding post to see how to use this tool on your dataset.

Get code

Related chart types


Chord diagram
Network
Sankey
Arc diagram
Edge bundling