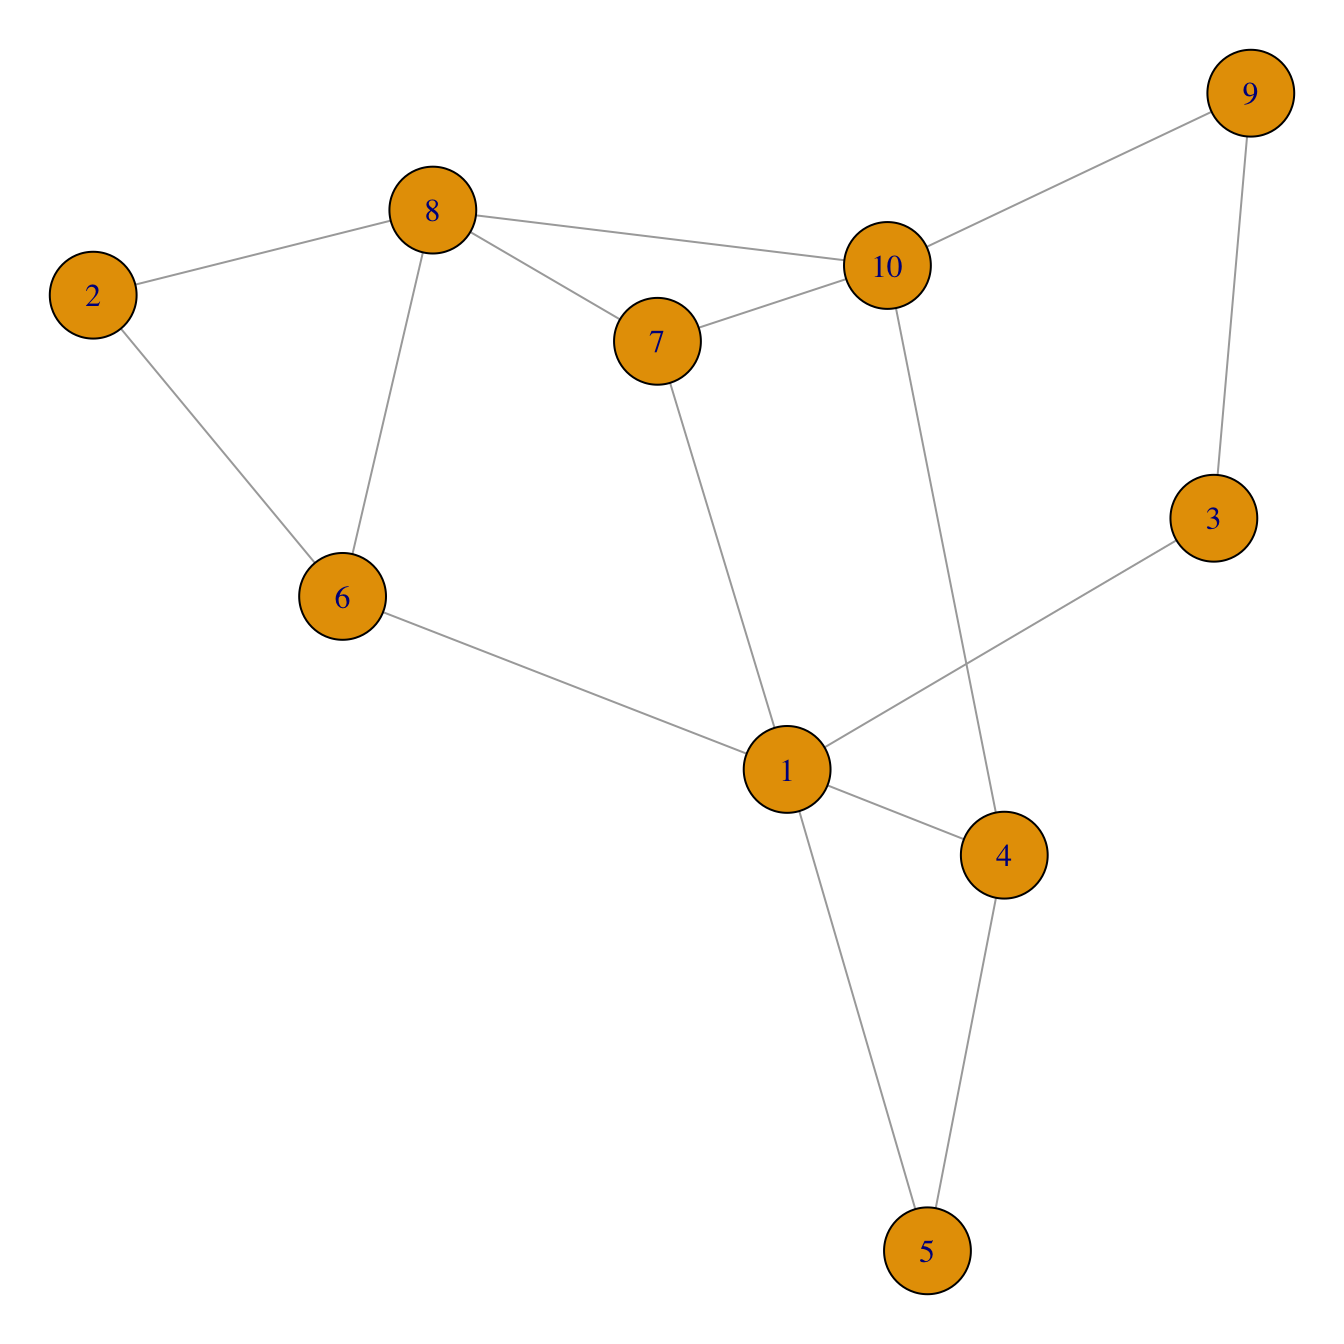
Default network chart with igraph
This post assumes you already know how to build a basic network
chart with the igraph library. If you don’t have a look
to the network section that provides an
introduction.
Basically, igraph allows to transform several types of
input into a graph object that can be plotted using the
plot() function as follow:
# Library
library(igraph)

# Create data
set.seed(1)
data <- matrix(sample(0:1, 100, replace=TRUE, prob=c(0.8,0.2)), nc=10)
network <- graph_from_adjacency_matrix(data , mode='undirected', diag=F )

# Default network
par(mar=c(0,0,0,0))
plot(network)
Customize node features
Node can be modified buy several arguments that all start with
vertex.. A vertex is a node in
igraph language. Main options are explained in the code
below:
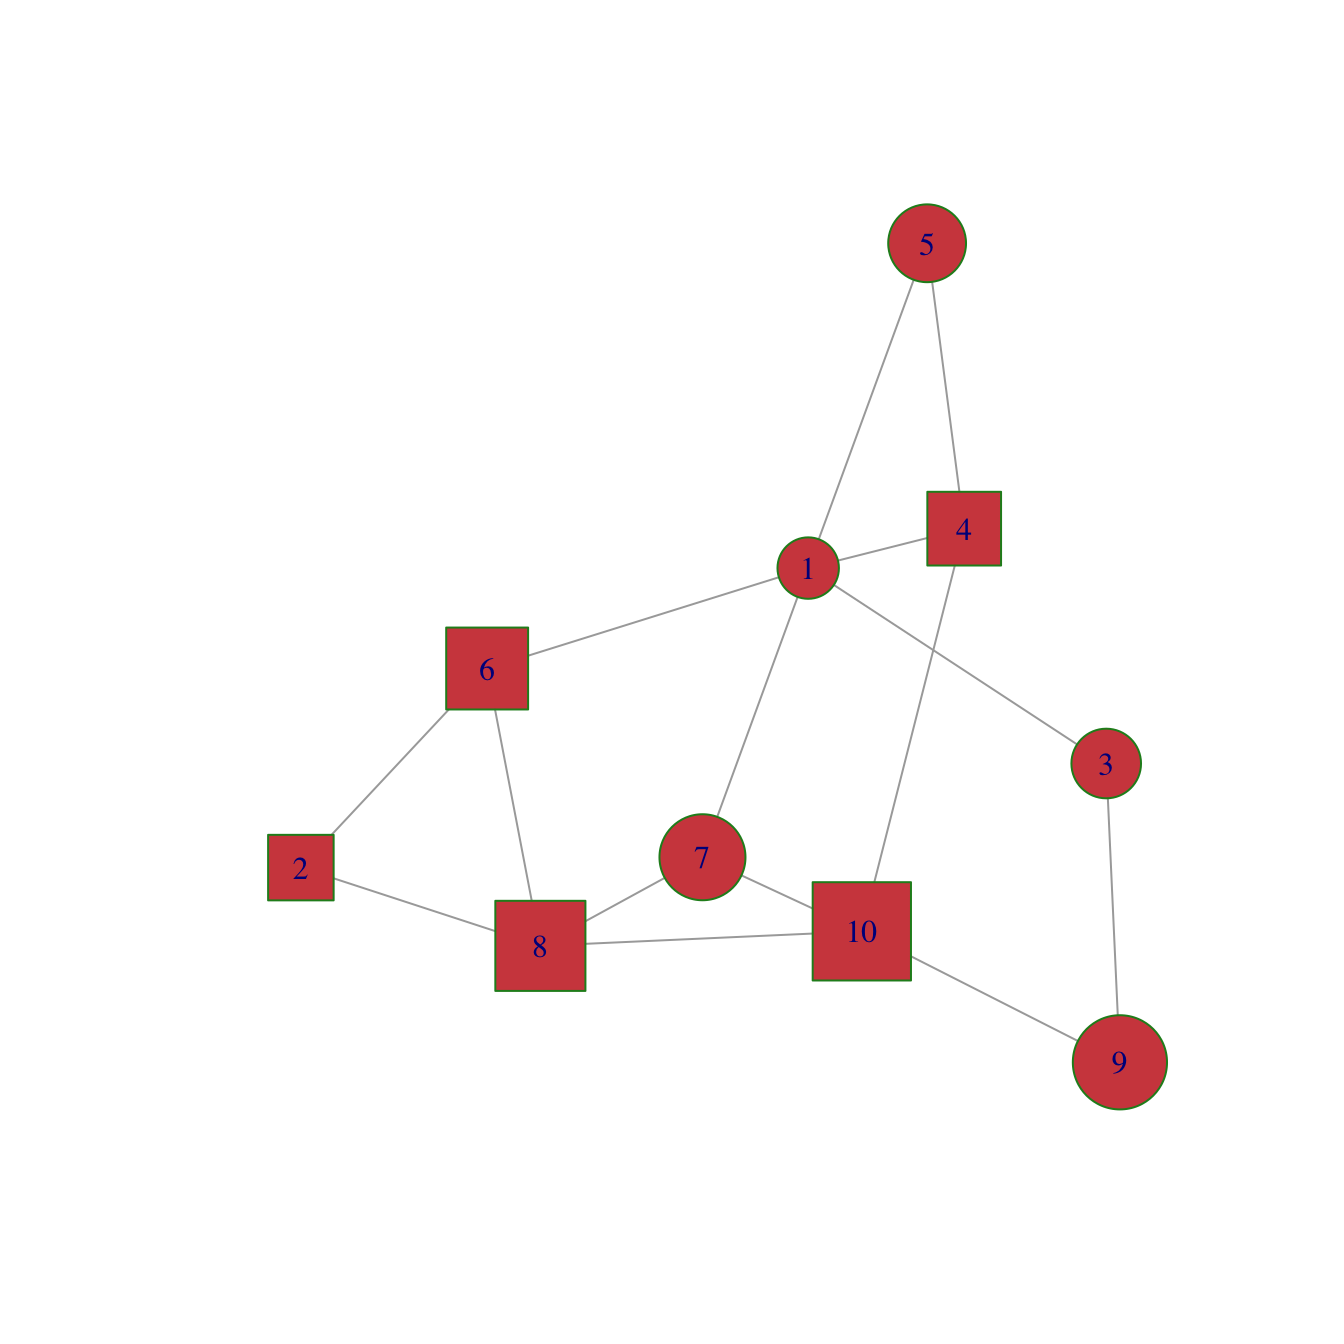
plot(network,
    vertex.color = rgb(0.8,0.2,0.2,0.9),           # Node color
    vertex.frame.color = "Forestgreen",            # Node border color
    vertex.shape=c("circle","square"),             # One of “none”, “circle”, “square”, “csquare”, “rectangle” “crectangle”, “vrectangle”, “pie”, “raster”, or “sphere”
    vertex.size=c(15:24),                          # Size of the node (default is 15)
    vertex.size2=NA,                               # The second size of the node (e.g. for a rectangle)
    )
Customize label features
Following the same principle, options starting with
vertex.label. control the labgel features. Note that
when several values are provided to an option, values are used
subsequently and recycled.
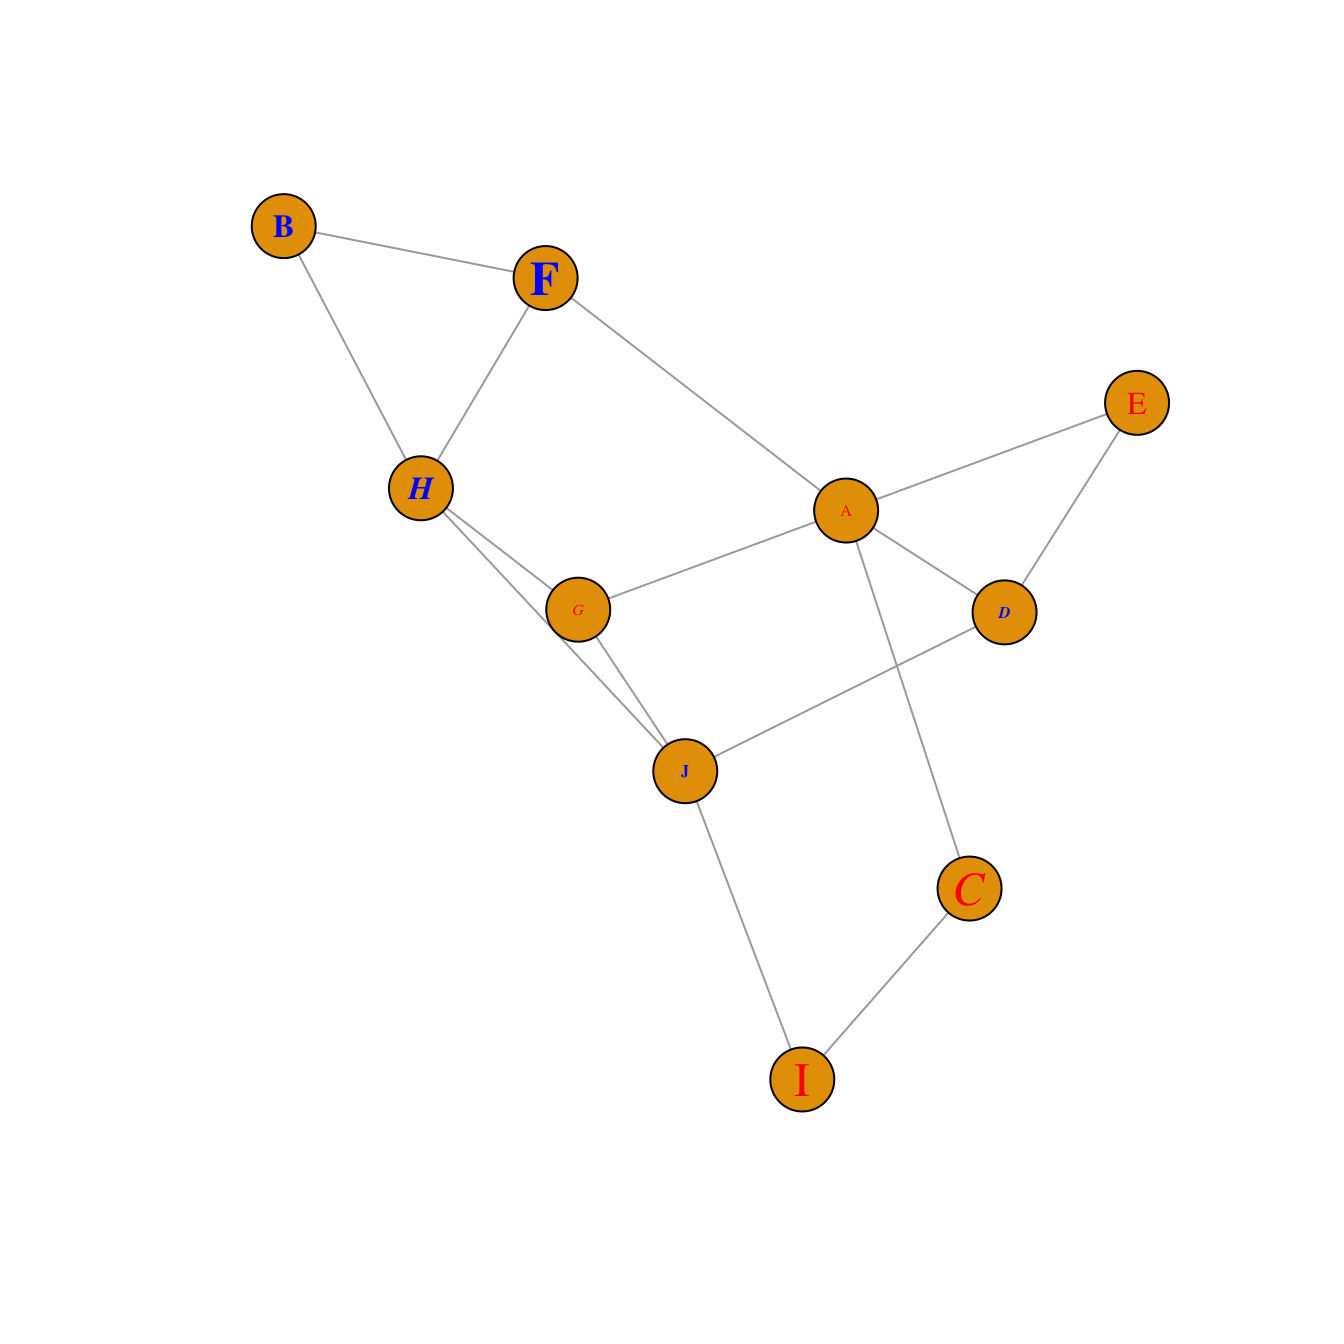
plot(network,
    vertex.label=LETTERS[1:10],                    # Character vector used to label the nodes
    vertex.label.color=c("red","blue"),
    vertex.label.family="Times",                   # Font family of the label (e.g.“Times”, “Helvetica”)
    vertex.label.font=c(1,2,3,4),                  # Font: 1 plain, 2 bold, 3, italic, 4 bold italic, 5 symbol
    vertex.label.cex=c(0.5,1,1.5),                 # Font size (multiplication factor, device-dependent)
    vertex.label.dist=0,                           # Distance between the label and the vertex
    vertex.label.degree=0 ,                        # The position of the label in relation to the vertex (use pi)
    )
Customize link features
Last but not least, control edges with arguments starting with
edge..
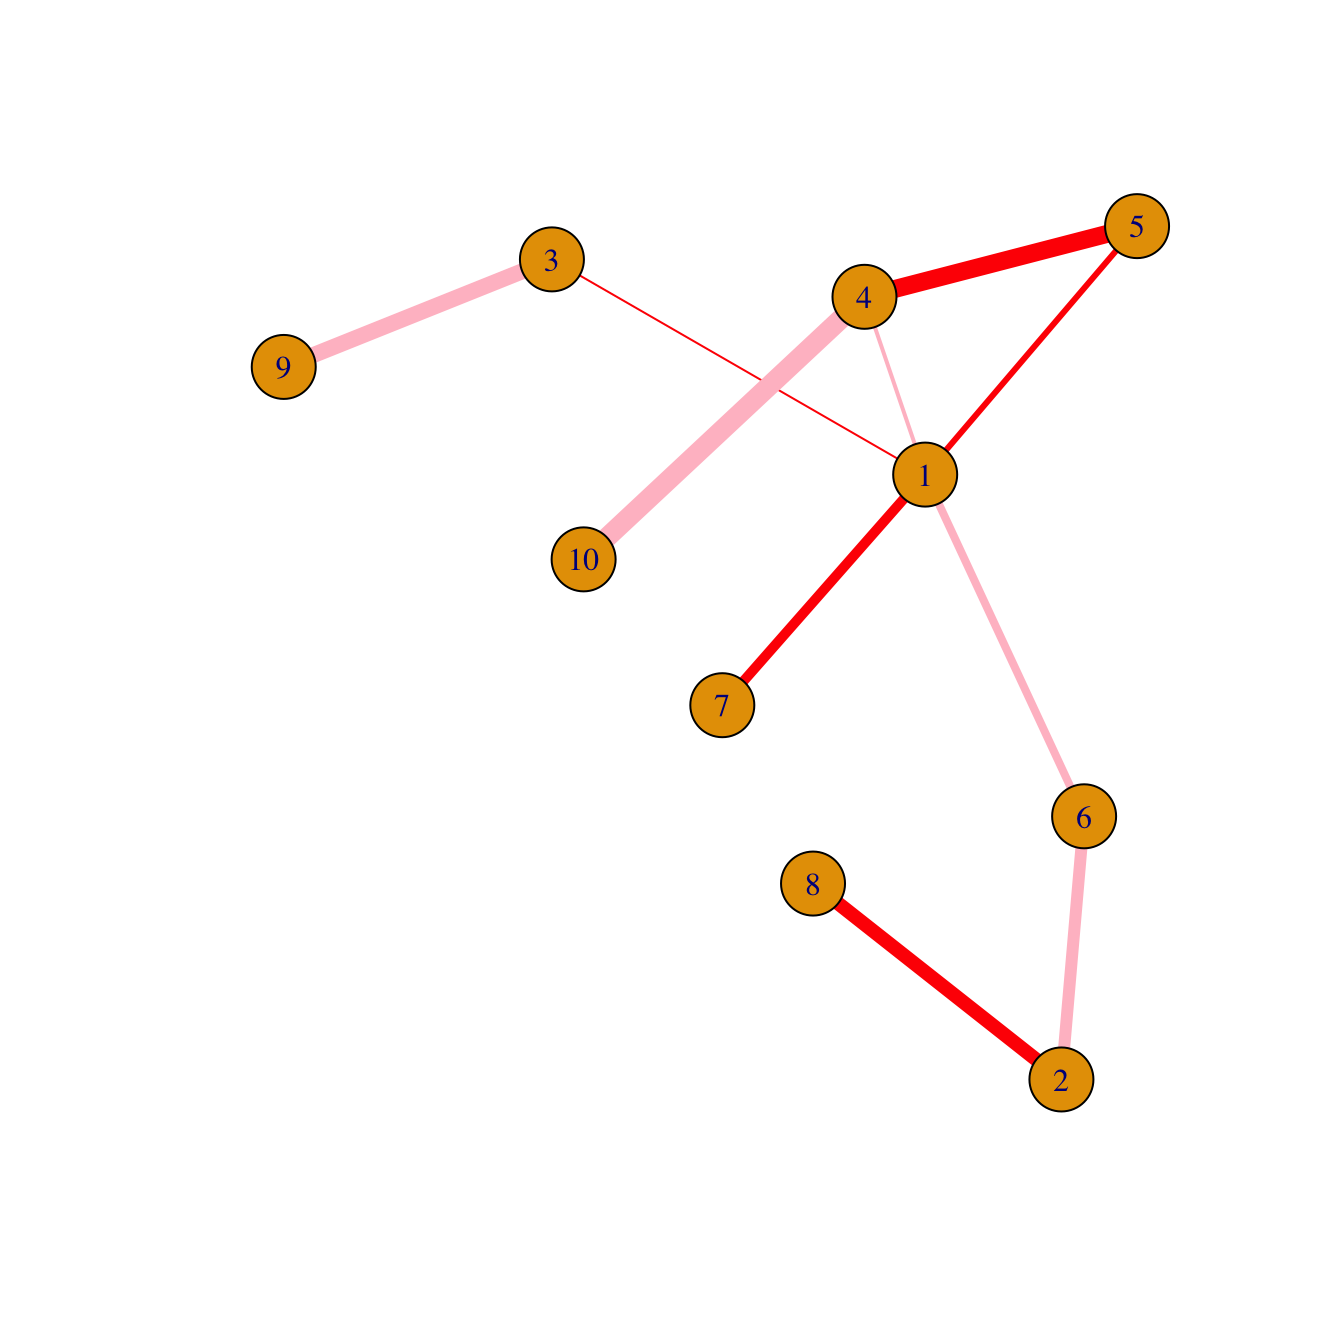
plot(network,
    edge.color=rep(c("red","pink"),5),           # Edge color
    edge.width=seq(1,10),                        # Edge width, defaults to 1
    edge.arrow.size=1,                           # Arrow size, defaults to 1
    edge.arrow.width=1,                          # Arrow width, defaults to 1
    edge.lty=c("solid")                           # Line type, could be 0 or “blank”, 1 or “solid”, 2 or “dashed”, 3 or “dotted”, 4 or “dotdash”, 5 or “longdash”, 6 or “twodash”
    #edge.curved=c(rep(0,5), rep(1,5))            # Edge curvature, range 0-1 (FALSE sets it to 0, TRUE to 0.5)
    )
All customization
Of course, you can use all the options described above all together on the same chart, for a high level of customization.
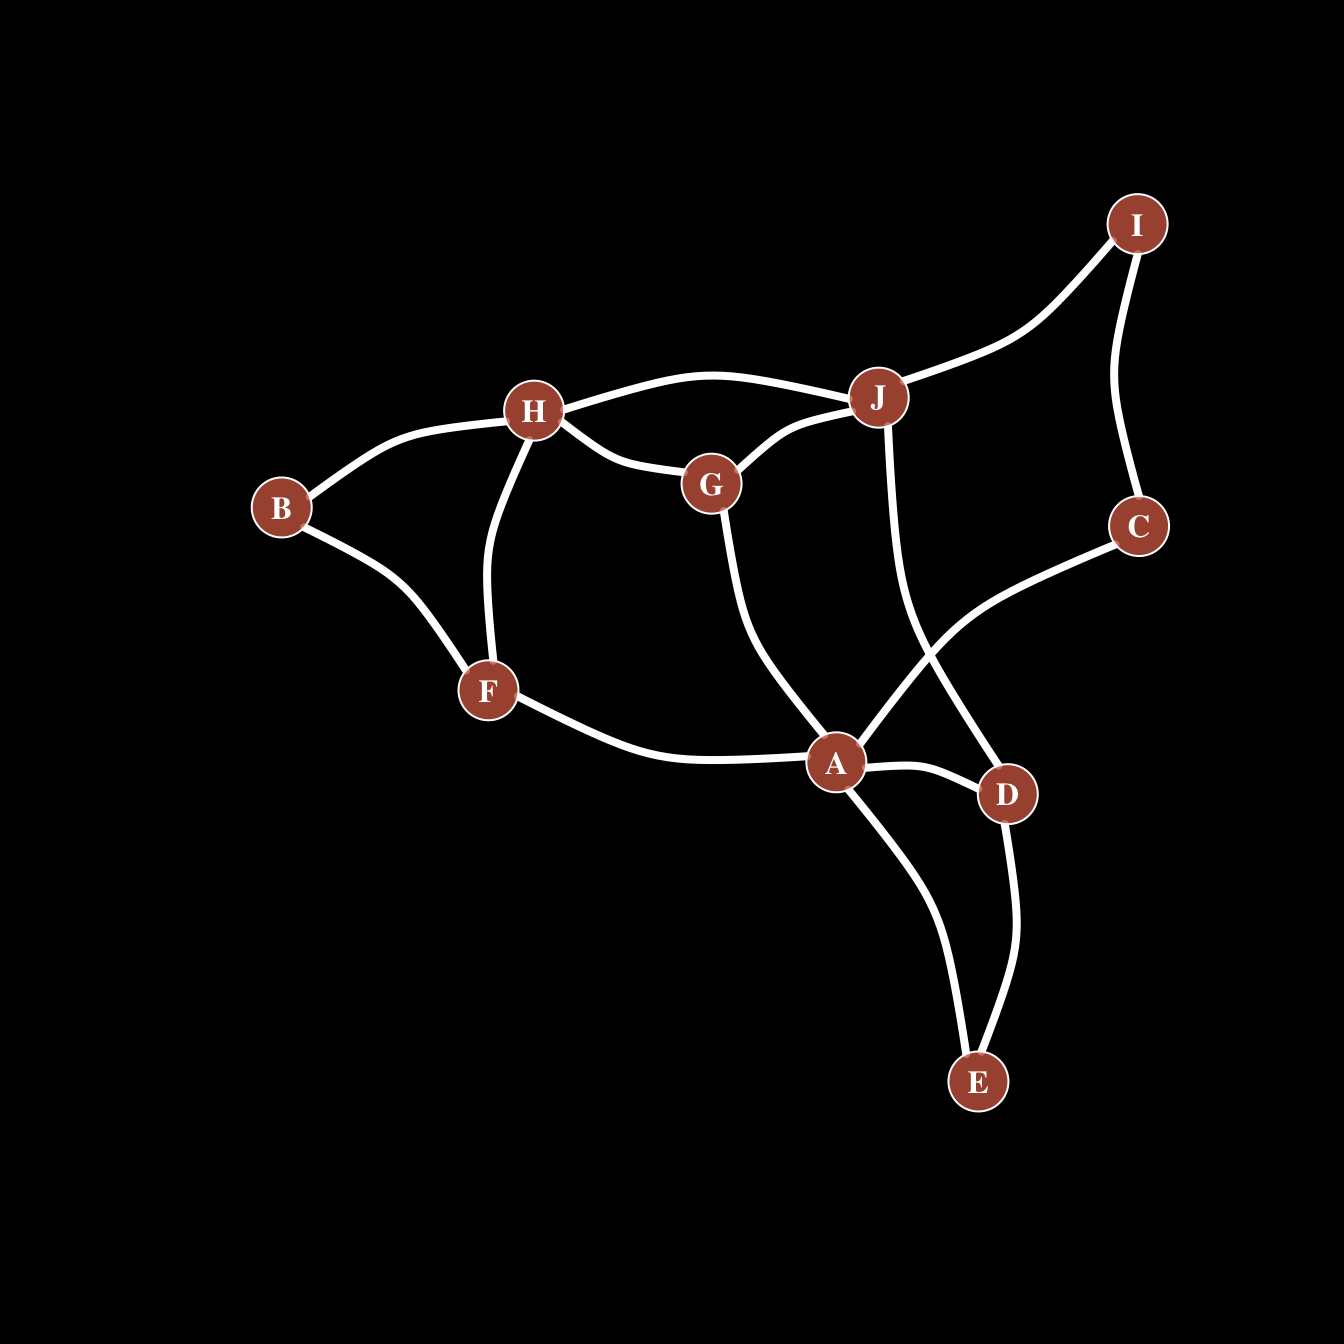
par(bg="black")

plot(network,

    # === vertex
    vertex.color = rgb(0.8,0.4,0.3,0.8),          # Node color
    vertex.frame.color = "white",                 # Node border color
    vertex.shape="circle",                        # One of “none”, “circle”, “square”, “csquare”, “rectangle” “crectangle”, “vrectangle”, “pie”, “raster”, or “sphere”
    vertex.size=14,                               # Size of the node (default is 15)
    vertex.size2=NA,                              # The second size of the node (e.g. for a rectangle)

    # === vertex label
    vertex.label=LETTERS[1:10],                   # Character vector used to label the nodes
    vertex.label.color="white",
    vertex.label.family="Times",                  # Font family of the label (e.g.“Times”, “Helvetica”)
    vertex.label.font=2,                          # Font: 1 plain, 2 bold, 3, italic, 4 bold italic, 5 symbol
    vertex.label.cex=1,                           # Font size (multiplication factor, device-dependent)
    vertex.label.dist=0,                          # Distance between the label and the vertex
    vertex.label.degree=0 ,                       # The position of the label in relation to the vertex (use pi)

    # === Edge
    edge.color="white",                           # Edge color
    edge.width=4,                                 # Edge width, defaults to 1
    edge.arrow.size=1,                            # Arrow size, defaults to 1
    edge.arrow.width=1,                           # Arrow width, defaults to 1
    edge.lty="solid",                             # Line type, could be 0 or “blank”, 1 or “solid”, 2 or “dashed”, 3 or “dotted”, 4 or “dotdash”, 5 or “longdash”, 6 or “twodash”
    edge.curved=0.3    ,                          # Edge curvature, range 0-1 (FALSE sets it to 0, TRUE to 0.5)
    )