Map variable to node features
Once you know how to make a basic network graph and how to customize its general features, you probably want to map the features according to another variable.
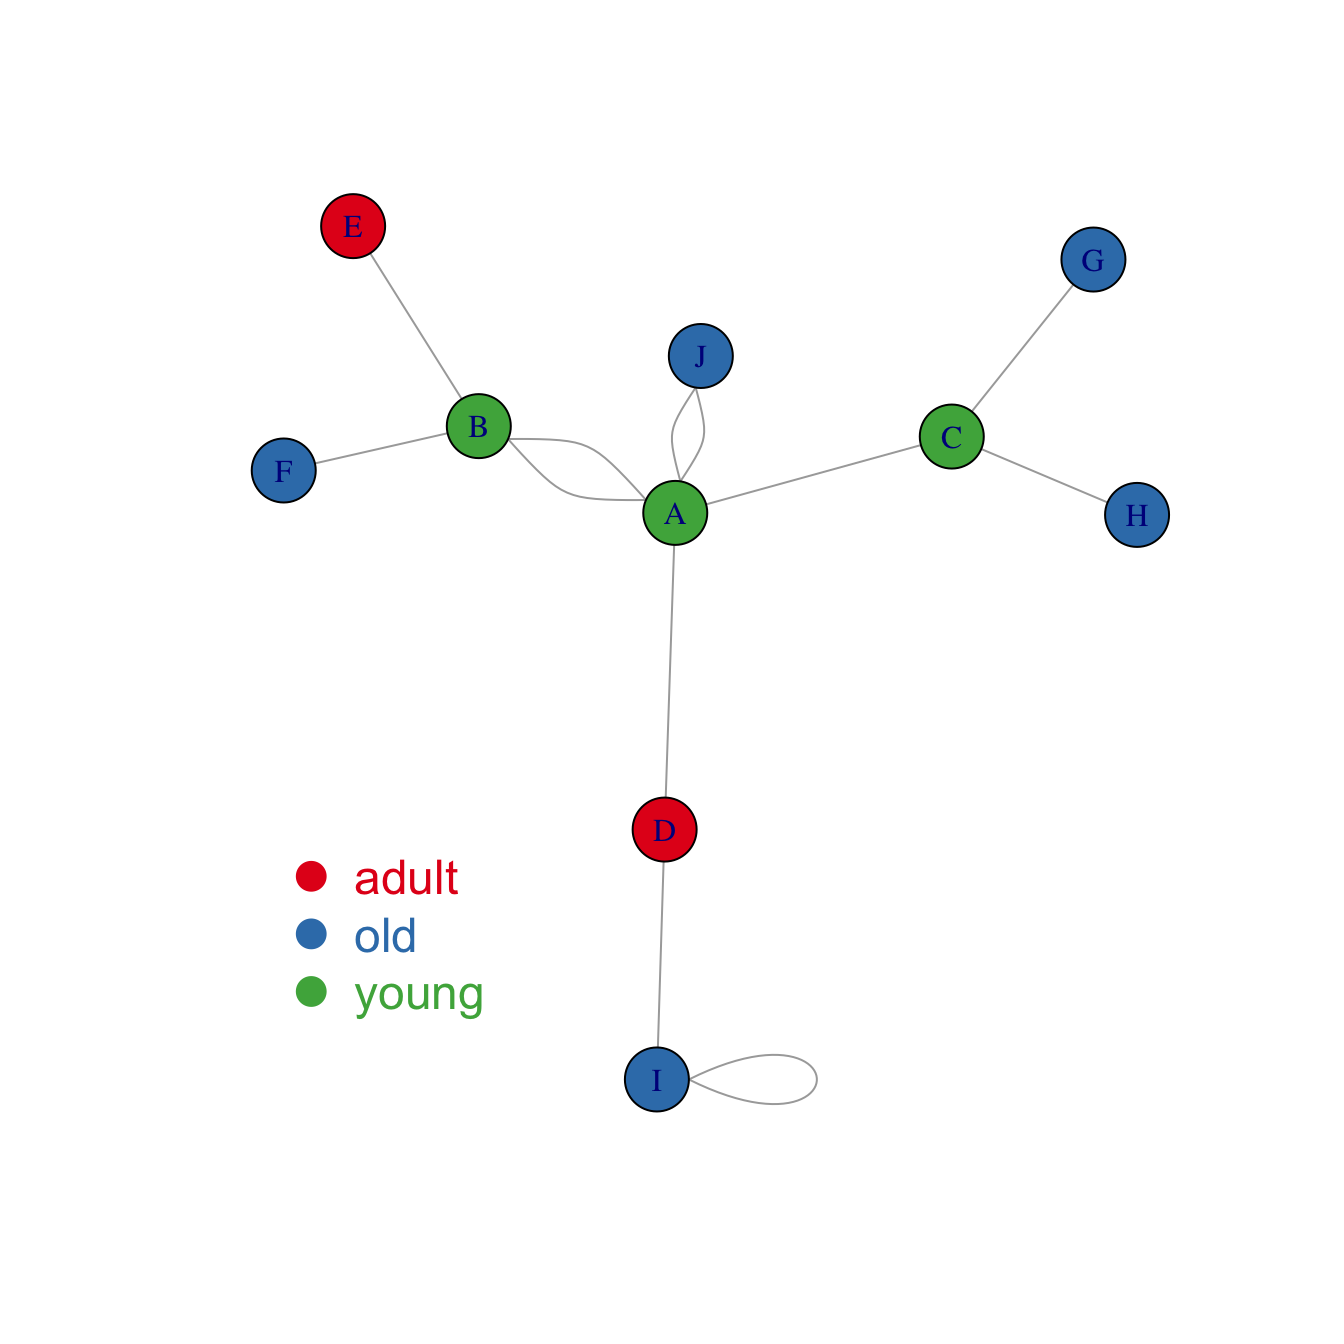
Here we consider a network with 10 people. Each is either adult, old or young and we want one specific color for each category.
The dataset is composed by 2 data frames.
Links provides the links between people.
Nodes gives features concerning people. What we need is
to transform the carac column into a vector of 3
colors, and provide this vector to the plot. The 3 colors are picked
up in an Rcolorbrewer palette as described in
graph #39.
# library
library(igraph)

# create data:
links <- data.frame(
    source=c("A","A", "A", "A", "A","J", "B", "B", "C", "C", "D","I"),
    target=c("B","B", "C", "D", "J","A","E", "F", "G", "H", "I","I"),
    importance=(sample(1:4, 12, replace=T))
    )
nodes <- data.frame(
    name=LETTERS[1:10],
    carac=c( rep("young",3),rep("adult",2), rep("old",5))
    )

# Turn it into igraph object
network <- graph_from_data_frame(d=links, vertices=nodes, directed=F)

# Make a palette of 3 colors
library(RColorBrewer)
coul  <- brewer.pal(3, "Set1")

# Create a vector of color
my_color <- coul[as.numeric(as.factor(V(network)$carac))]

# Make the plot
plot(network, vertex.color=my_color)

# Add a legend
legend("bottomleft", legend=levels(as.factor(V(network)$carac))  , col = coul , bty = "n", pch=20 , pt.cex = 3, cex = 1.5, text.col=coul , horiz = FALSE, inset = c(0.1, 0.1))
Map variable to link features
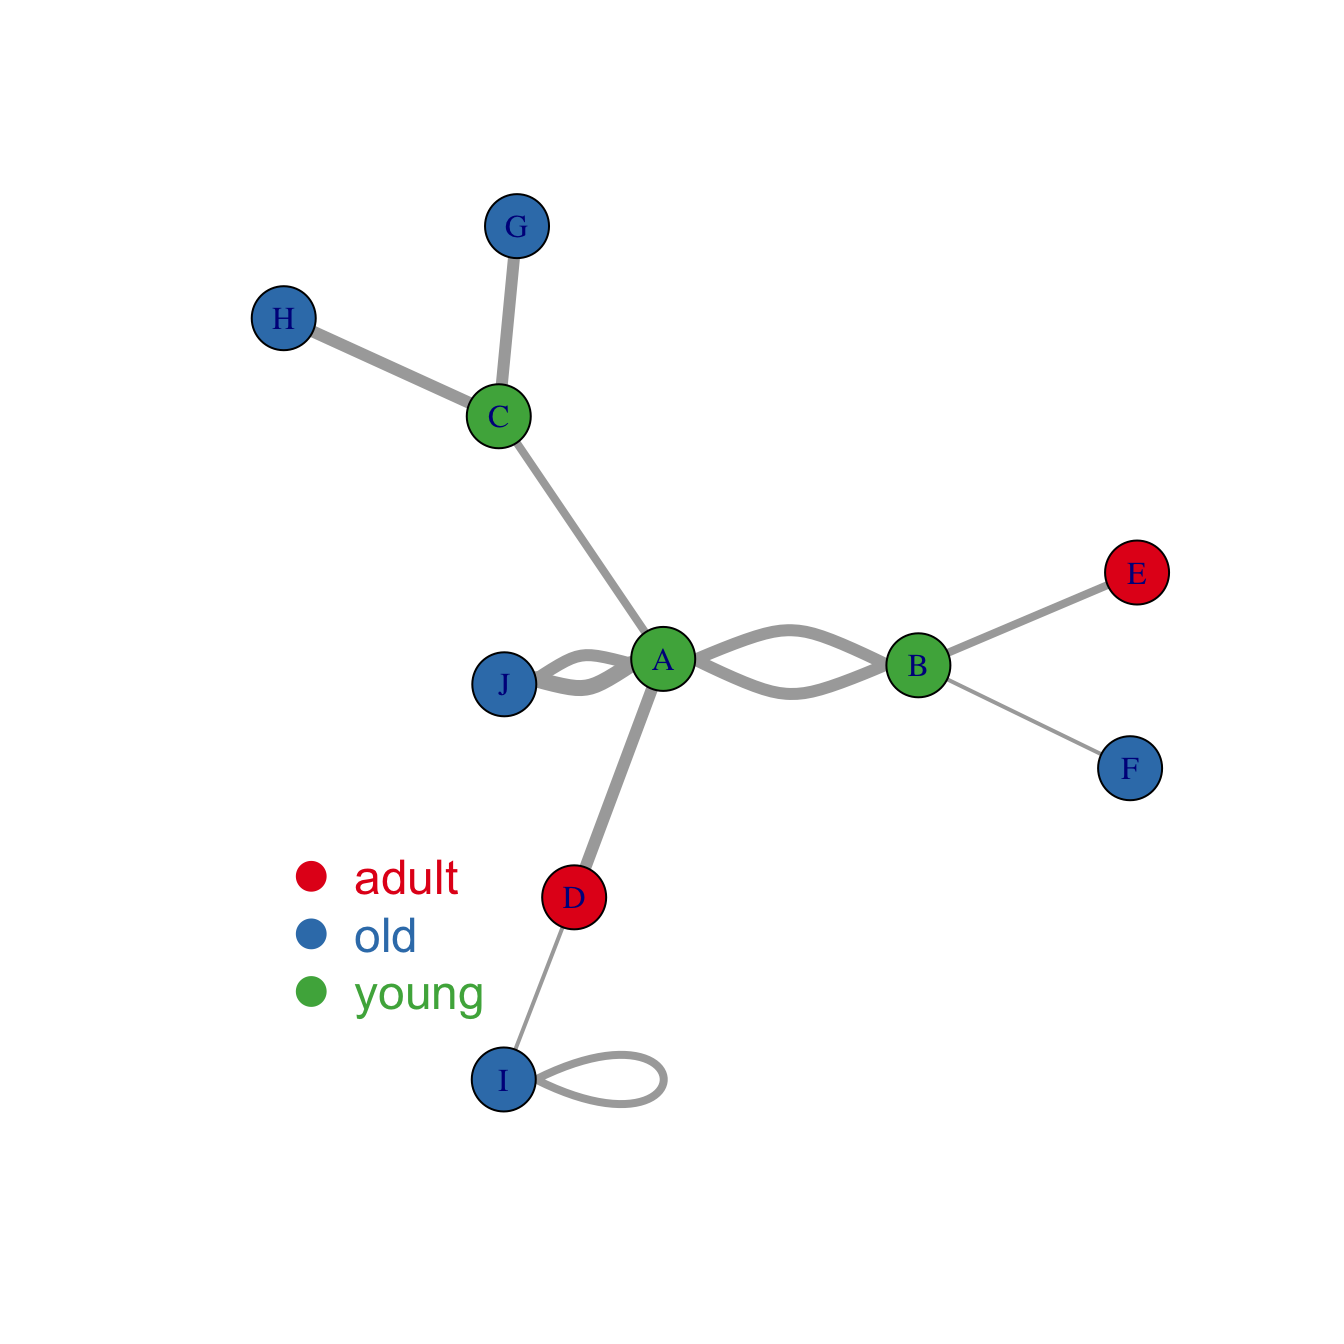
Following the same principle, it is possible to map other variables to other parameters.
Here is an example where we map the importance of the nodes to the
edge width. (There is an importance column in the
links data frame)