This page aims to provide useful R code to customize the strips of a
ggplot2 plots when using faceting. For other ggplot2
customization, visit the
dedicated page.
Here we want to modify non-data components, which is often done trough
the theme() command. This page is strongly inspired from
the help page of ggplot2 (?theme). Also, do not hesitate to
visit the very strong
ggplot2 documentation
for more information.
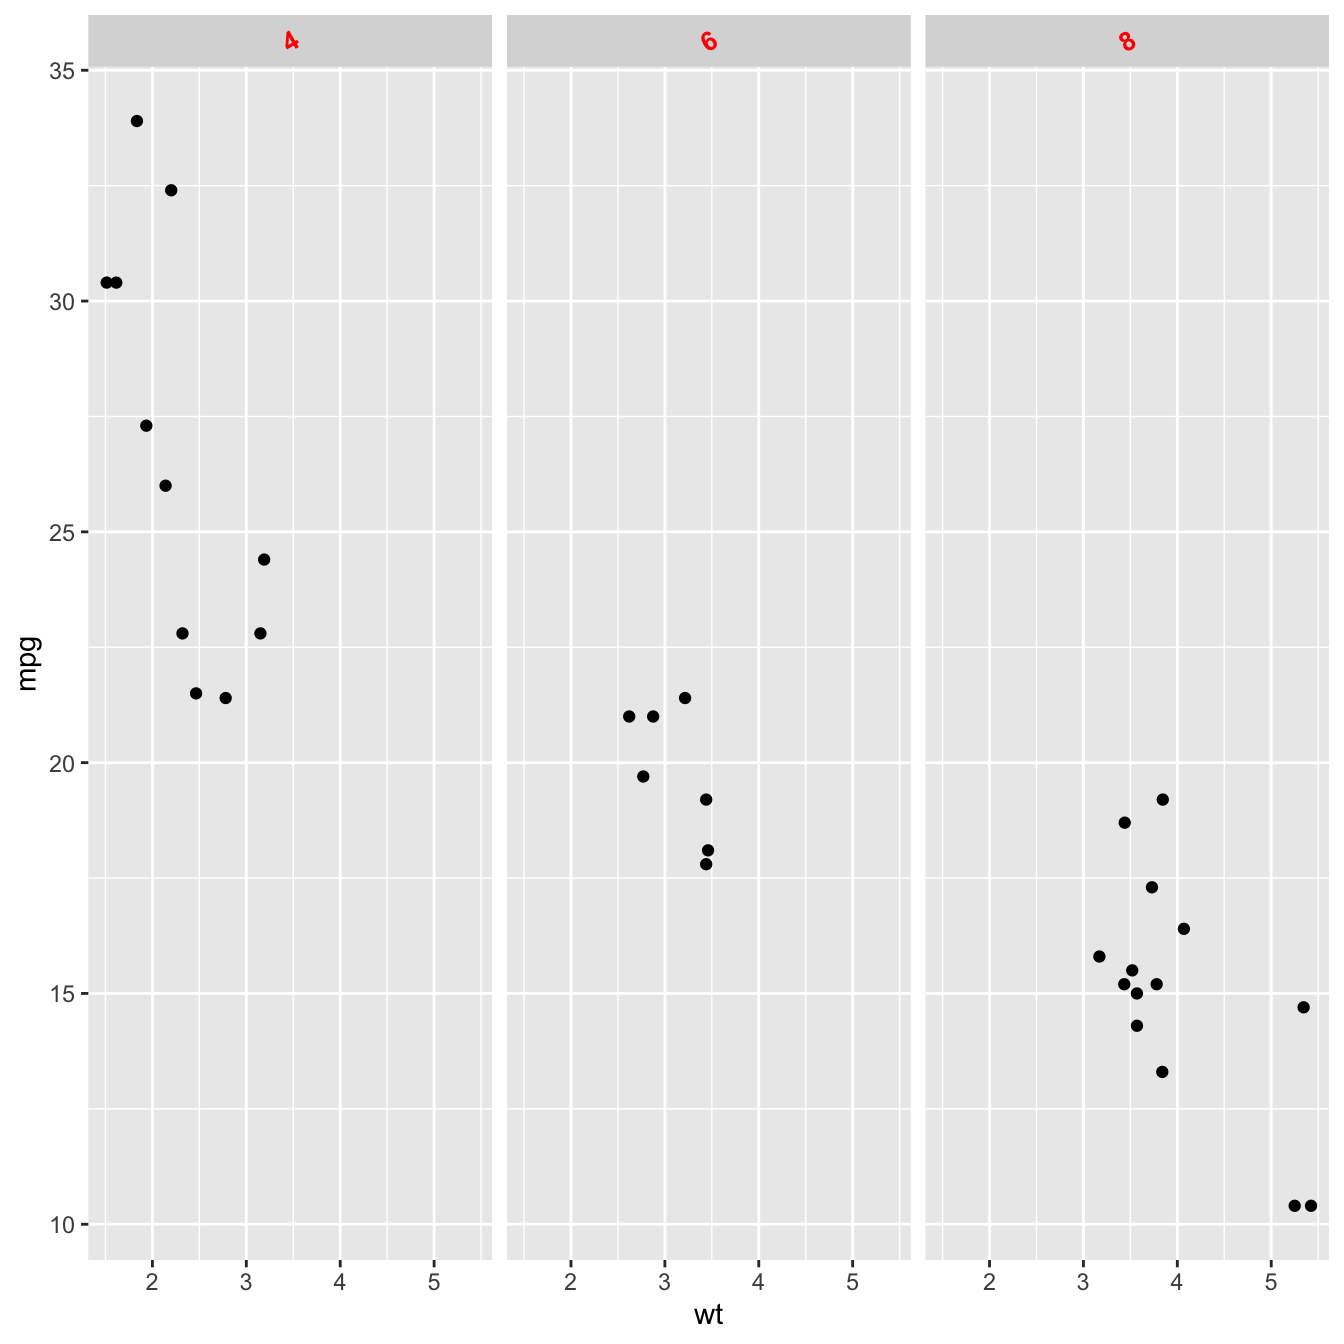
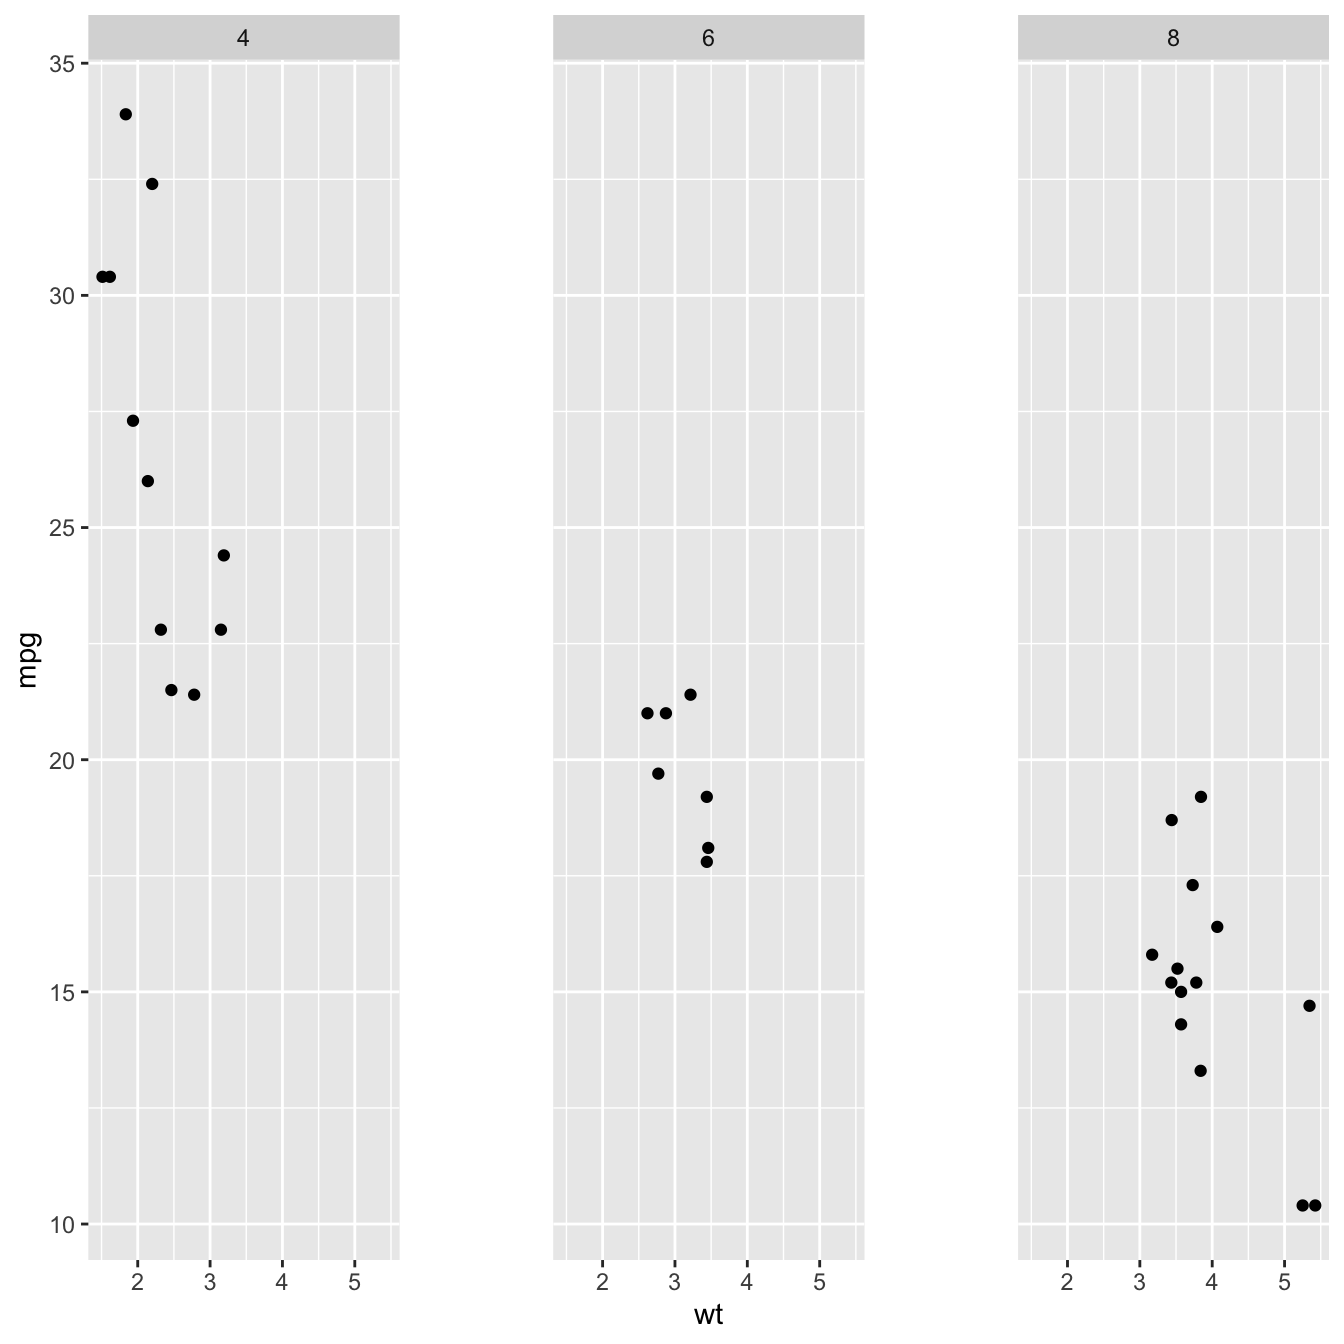
Chart 1 is a really basic plot relying on the
mtcars dataset. The 3 following charts show how to
customize strip background, text, and how to modify the
space between sections.
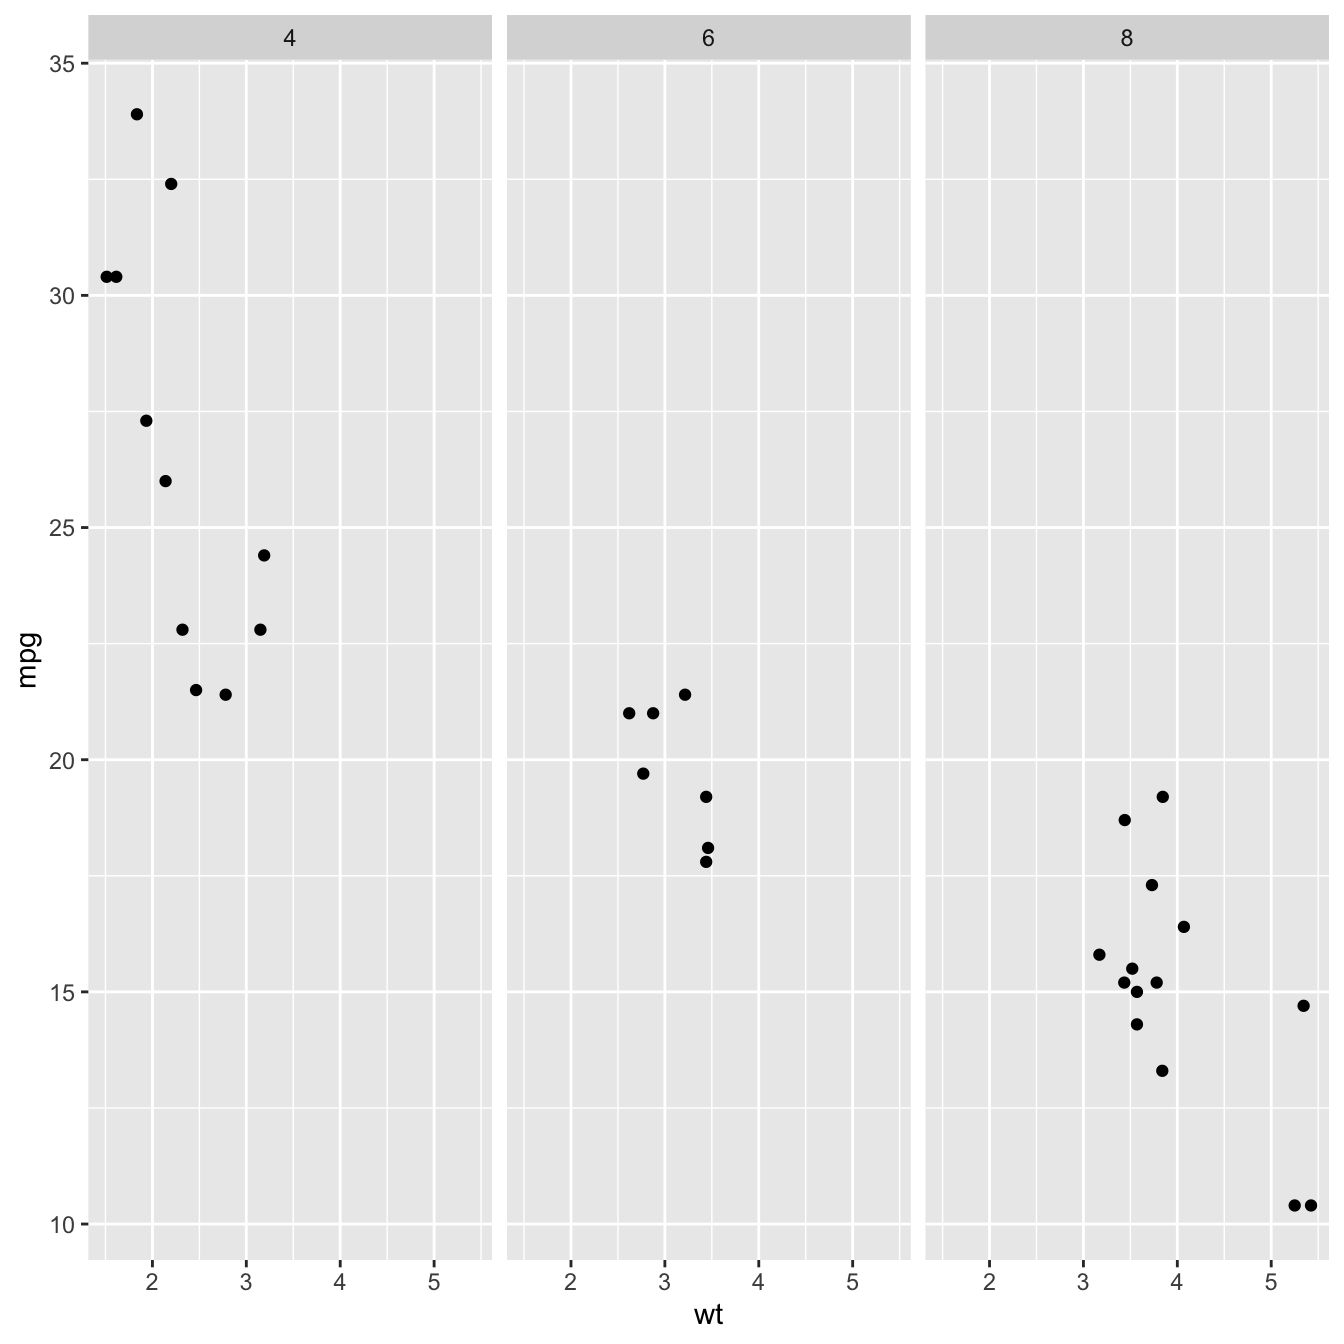
library(ggplot2)
# basic chart
basic=ggplot(mtcars, aes(wt, mpg)) +
geom_point() +
facet_wrap(~ cyl)
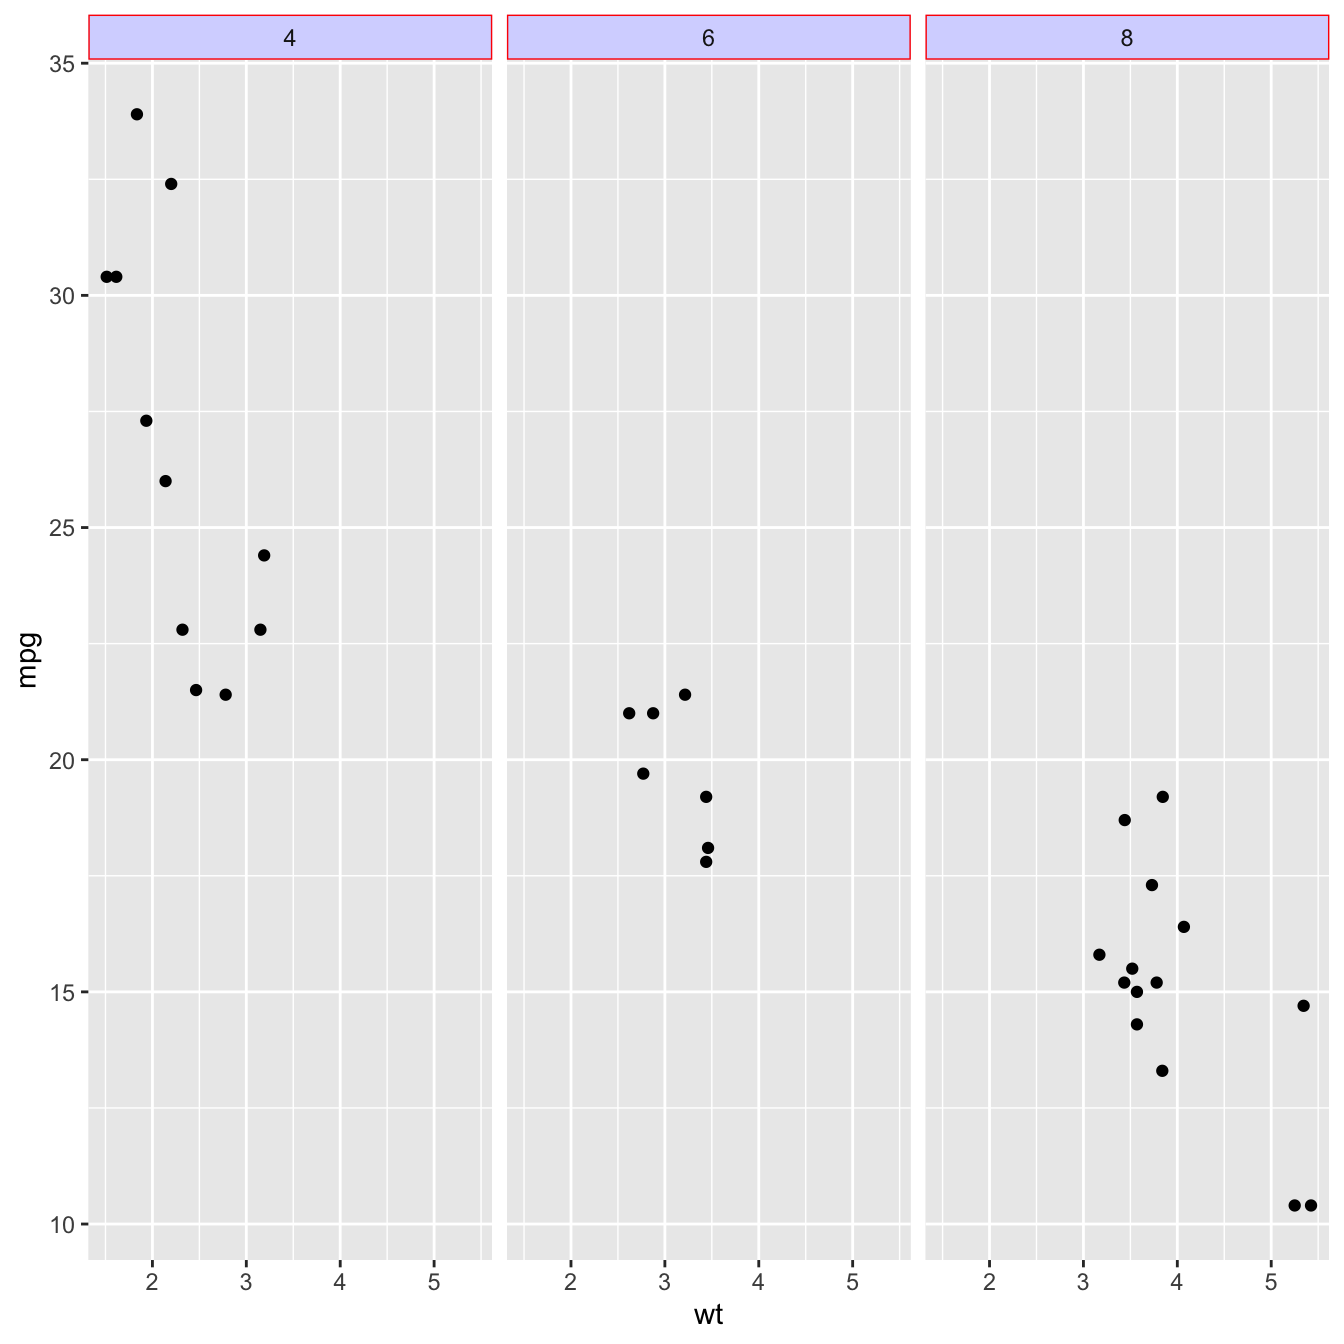
basic# Change background
basic + theme(strip.background = element_rect(colour = "red", fill = alpha("blue",0.2) ))


