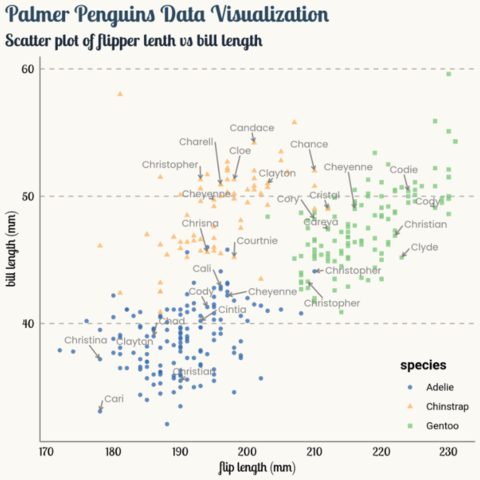
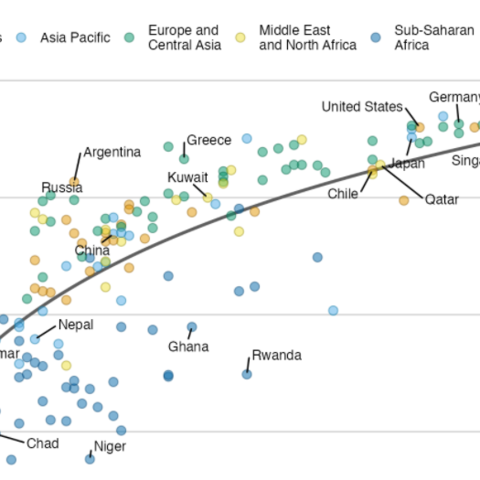
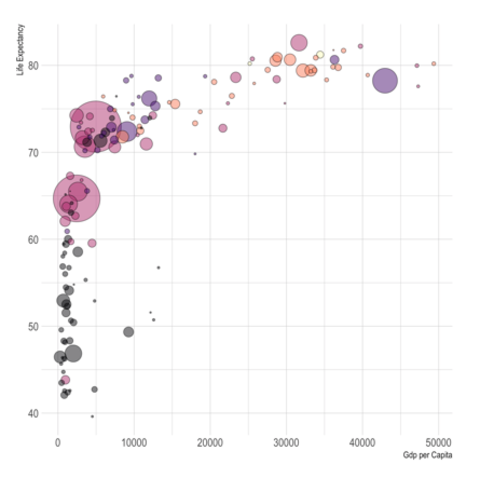
A bubble chart is a scatterplot
A bubble chart is basically a scatterplot with a third numeric variable used for circle size. Thus, remember all the tips described in the scatterplot section also apply here.
Scatterplot sectionStep by step with
ggplot2
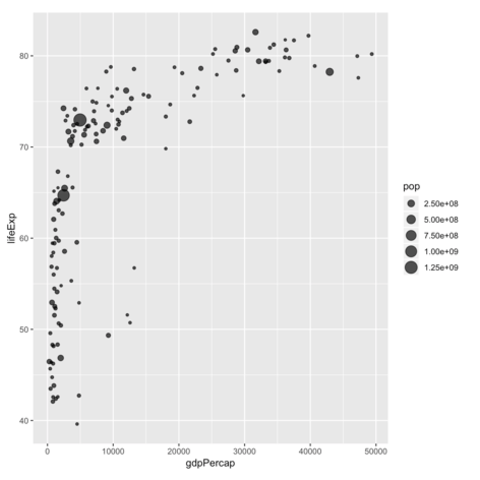
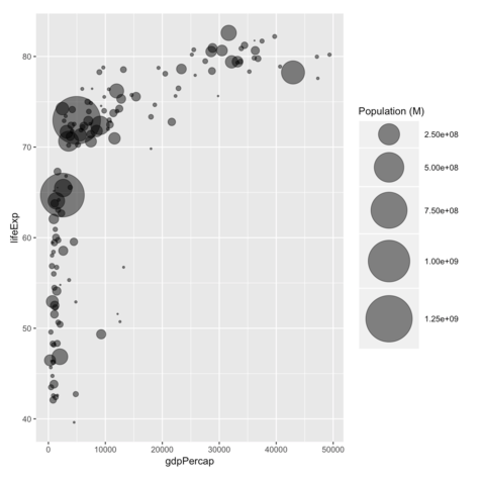
ggplot2 allows to create bubble
chart thanks to the geom_point() function. Next examples
will lead you through the process step by step:
Interactive version
Here is an interactive bubble chart built in R, thanks to the
ggplotly() function of the plotly library.
Try to hover circles to get a tooltip, or select an area of interest
for zooming. Double click to reinitialize.