Mixing multiple graphs on the same page is a common practice. It allows to summarize a lot of information on the same figure, and is for instance widely used for scientific publication.
The gridExtra package makes it a breeze. It offers the
grid.arrange() function that does exactly that. Its
nrow argument allows to specify how to arrange the layout.
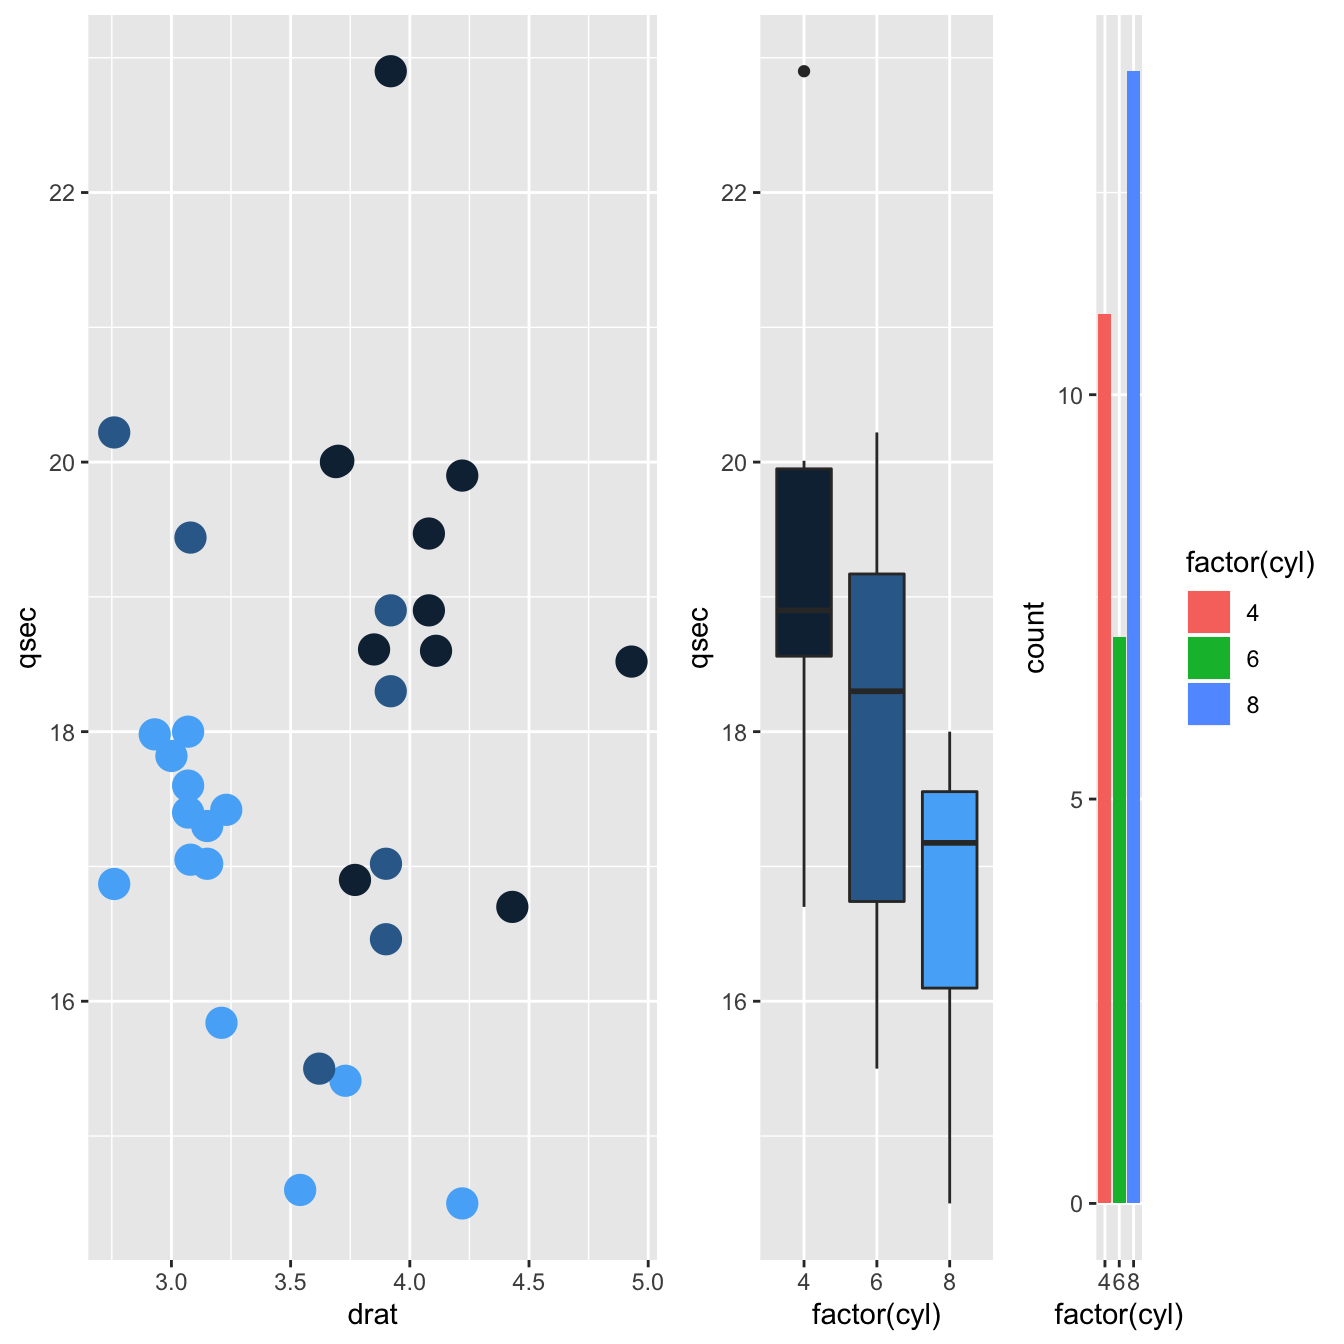
For more complex layout, the arrangeGrob() functions allows
to do some nesting. Here are 4 examples to illustrate how
gridExtra works:

# libraries
library(ggplot2)
library(gridExtra)
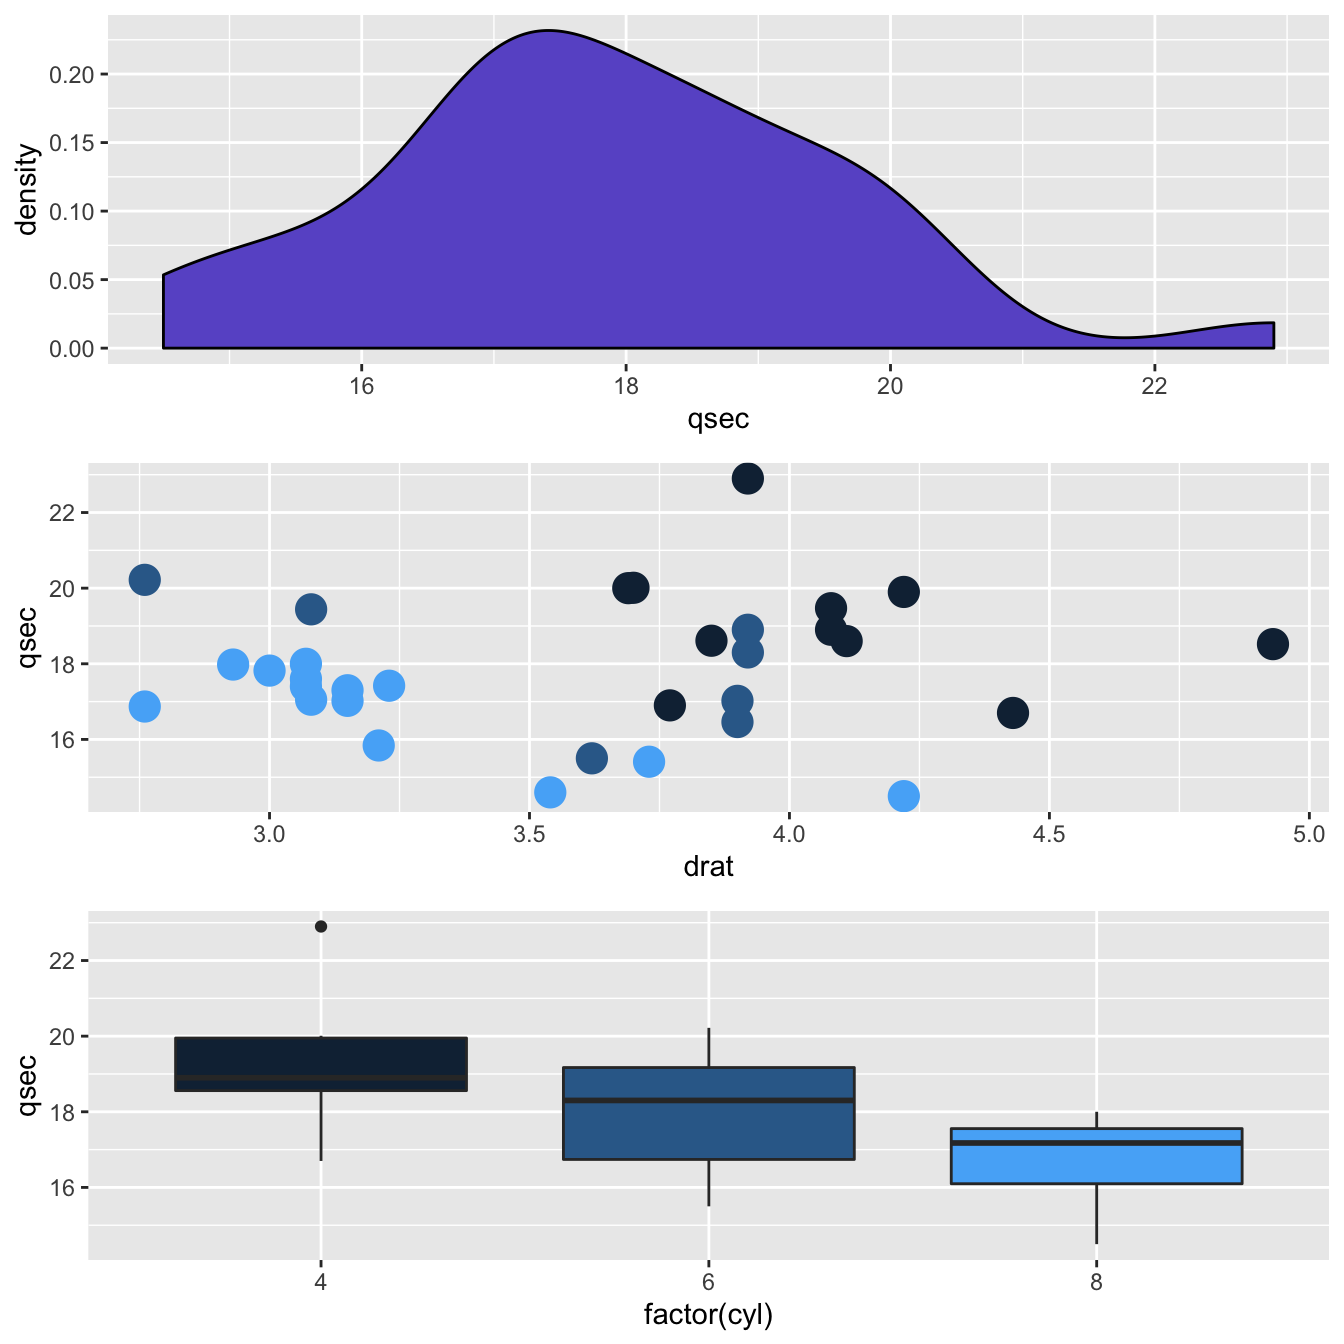
# Make 3 simple graphics:
g1 <- ggplot(mtcars, aes(x=qsec)) + geom_density(fill="slateblue")
g2 <- ggplot(mtcars, aes(x=drat, y=qsec, color=cyl)) + geom_point(size=5) + theme(legend.position="none")
g3 <- ggplot(mtcars, aes(x=factor(cyl), y=qsec, fill=cyl)) + geom_boxplot() + theme(legend.position="none")
g4 <- ggplot(mtcars , aes(x=factor(cyl), fill=factor(cyl))) + geom_bar()
# Plots
grid.arrange(g2, arrangeGrob(g3, g4, ncol=2), nrow = 2)


